

Why context decides whether a setup works
The same candle pattern or indicator signal can give very different results on different days. Context decides how far momentum runs, how reliable a reversal is, and how the option premium behaves. Scalping becomes more consistent when you stop chasing single signals and line your trades up with the market's conditions.
- Trend or chop. A breakout in an active, high-volume trend often continues cleanly. The same breakout inside a quiet, low-volume range often fails, and the premium decays while you wait.
- Location. Price does not react at random. Strong reactions usually happen at levels where large participants are active. A trade taken in the middle of a range, away from any level, has no edge from location.
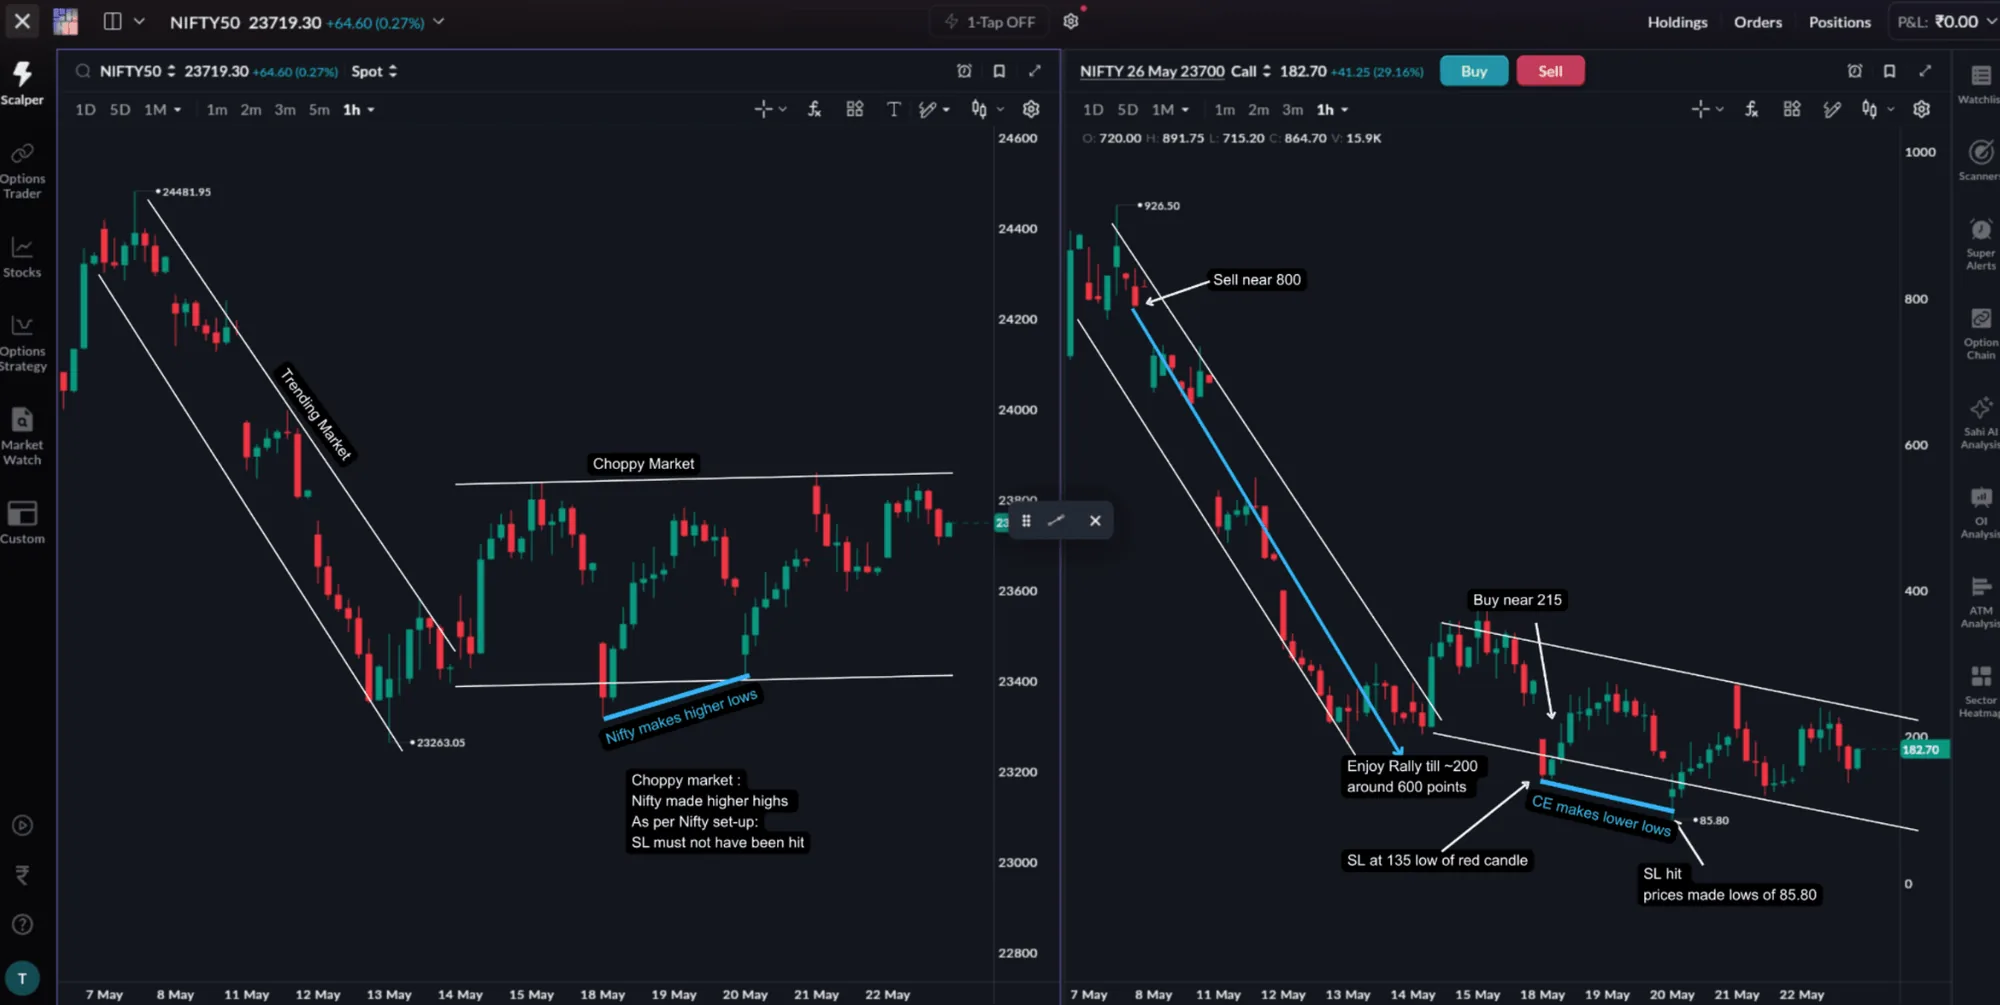
Three things tell you the context: where positions are building (open interest), where price has reacted before (key levels), and how fast the market is moving (volatility).
Open interest: where positions are building
Open interest (OI) is the total number of derivative contracts that are still open, that is, not yet closed or settled. It is not the same as volume. Volume counts every contract traded today; OI counts only the positions still held.
- OI rises when a new buyer and a new seller open a fresh position.
- OI falls when existing positions are closed.
In options, the useful question is where OI is concentrated. Writing (selling) options needs large margin, so a heavy pile of OI at one strike usually reflects well-capitalised sellers who have a stake in where price ends up. Such a strike often becomes an important zone on the chart.
Using SAHI's OI tools
SAHI's OI tools show these zones directly on the chart. The OI Profile draws the OI at each strike beside the price axis, and the OI Filter and the OI support and resistance markers help you spot fresh build-up and shifting positions during the session. You can watch price and OI together without switching between the chart and the option chain.
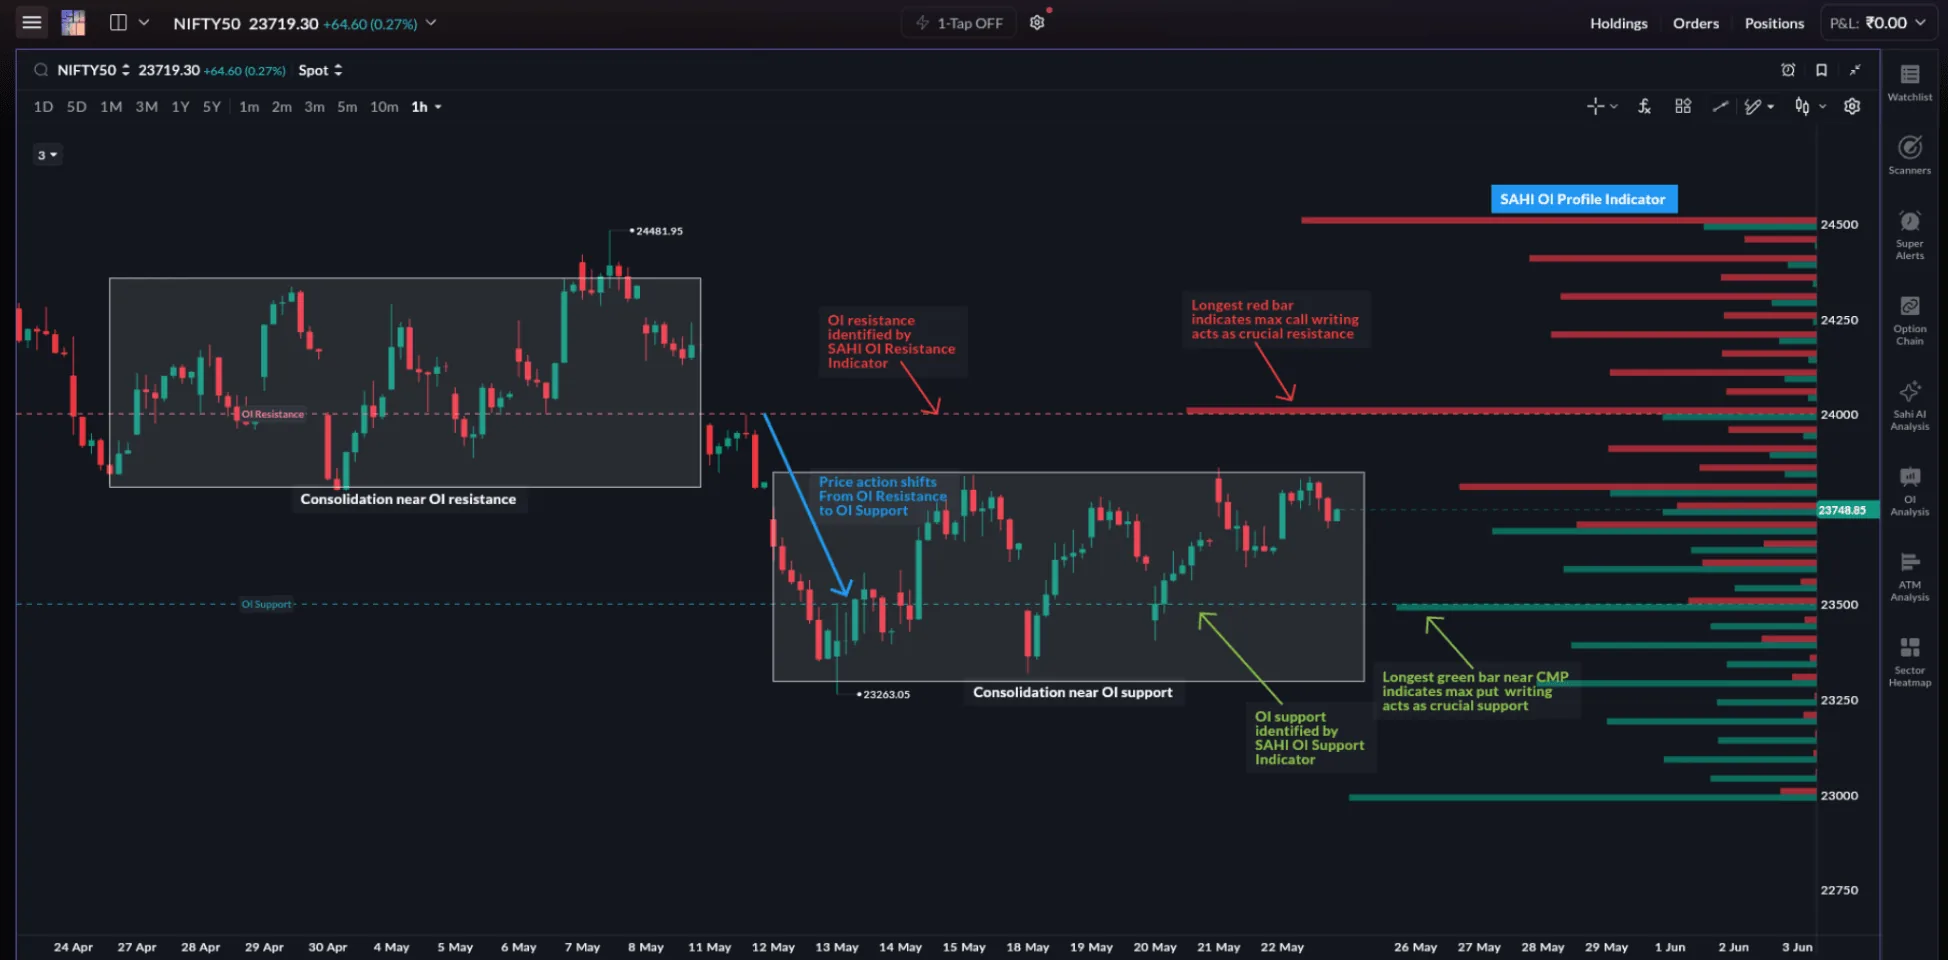
OI walls as support and resistance
A strike with very large OI is often called an OI wall. The two kinds behave differently:
| Wall | Where it sits | Why it matters | Usual behaviour |
|---|---|---|---|
| Heavy call (CE) OI | Above the current price | Call writers lose if price rises above the strike | Acts as resistance; rallies often slow near it |
| Heavy put (PE) OI | Below the current price | Put writers lose if price falls below the strike | Acts as support; falls often slow near it |
The sample chart below shows a session between a put wall at 23,900 and a call wall at 24,100. Watch how price behaves at each line, and what changes when the call wall gives way.
- Up
- Down
- Put OI wall (support)
- Call OI wall (resistance)
- Put wall holds. Price falls to 23,900 in the first 9 candles. One candle dips to 23,894 and closes back at 23,916: sellers could not hold price below the wall.
- Call wall rejects. 16 candles later price reaches 24,102 and closes below 24,100. The next two candles close lower.
- Second test of support. About 19 candles later price is back at the put wall. The low is 23,898 and the next candle closes higher at 23,924.
- Second test of resistance. Price touches 24,105 but closes at 24,097, still below the wall. No candle has closed above 24,100 all morning.
- Breakout on volume. Six candles later a strong candle closes at 24,134 on the highest volume of the session. If call OI at 24,100 is falling at the same time, writers are leaving the wall.
- Retest holds. About 7 candles later price dips back to 24,101 on light volume and holds. The old resistance now acts as support, and fresh put writing at 24,100 would confirm it. The next call wall, 24,200, becomes the target zone.
An OI wall is a zone where you expect a reaction, not a line that cannot break. Trade the reaction you see in the candles at the wall: a rejection, or a breakout that closes beyond it and holds on the retest.
When the walls shift
Static levels tell only part of the story. Watch the change in OI at the walls as price approaches them:
| Price is… | OI change you see | What it suggests |
|---|---|---|
| Stalling below a call wall | Call OI at that strike keeps rising | Writers are adding; the resistance is getting stronger |
| Pressing into a call wall | Call OI there falls, put OI builds at the strike below | Writers are repositioning higher; a breakout is more likely to hold |
| Holding above a put wall | Put OI at that strike keeps rising | Writers are defending; the support is getting stronger |
| Pressing into a put wall | Put OI there falls, call OI builds at the strike above | Writers are repositioning lower; a breakdown is more likely to hold |
How scalpers use OI walls
- Plan reaction zones. Mark the walls before the move reaches them, and expect price to slow or react there.
- Do not buy straight into a wall. Avoid buying calls just below heavy call OI, or buying puts just above heavy put OI, without confirmation from the candles.
- Separate strong breakouts from weak ones. A break of a wall with OI unwinding there and volume rising is stronger than a poke through on light volume.
Key price levels: where price has reacted before
OI shows where derivative positions sit. Market structure shows where price itself has reacted. On SAHI, the Key Levels indicator marks important reaction zones on the chart automatically. The levels most worth marking are:
- Previous day's high and low. Important reference points for both buyers and sellers.
- Intraday swing highs and lows. Places where price reversed earlier in the session.
- Round numbers. Levels such as Nifty 24,000 or 24,500, where orders naturally cluster.
- Supply and demand zones. Areas of consolidation where strong buying or selling took place before.
These levels shape reversals, breakouts, stop-loss placement and continuation. A clean break and hold above a key level often supports continuation; a rejection there often starts a reversal.
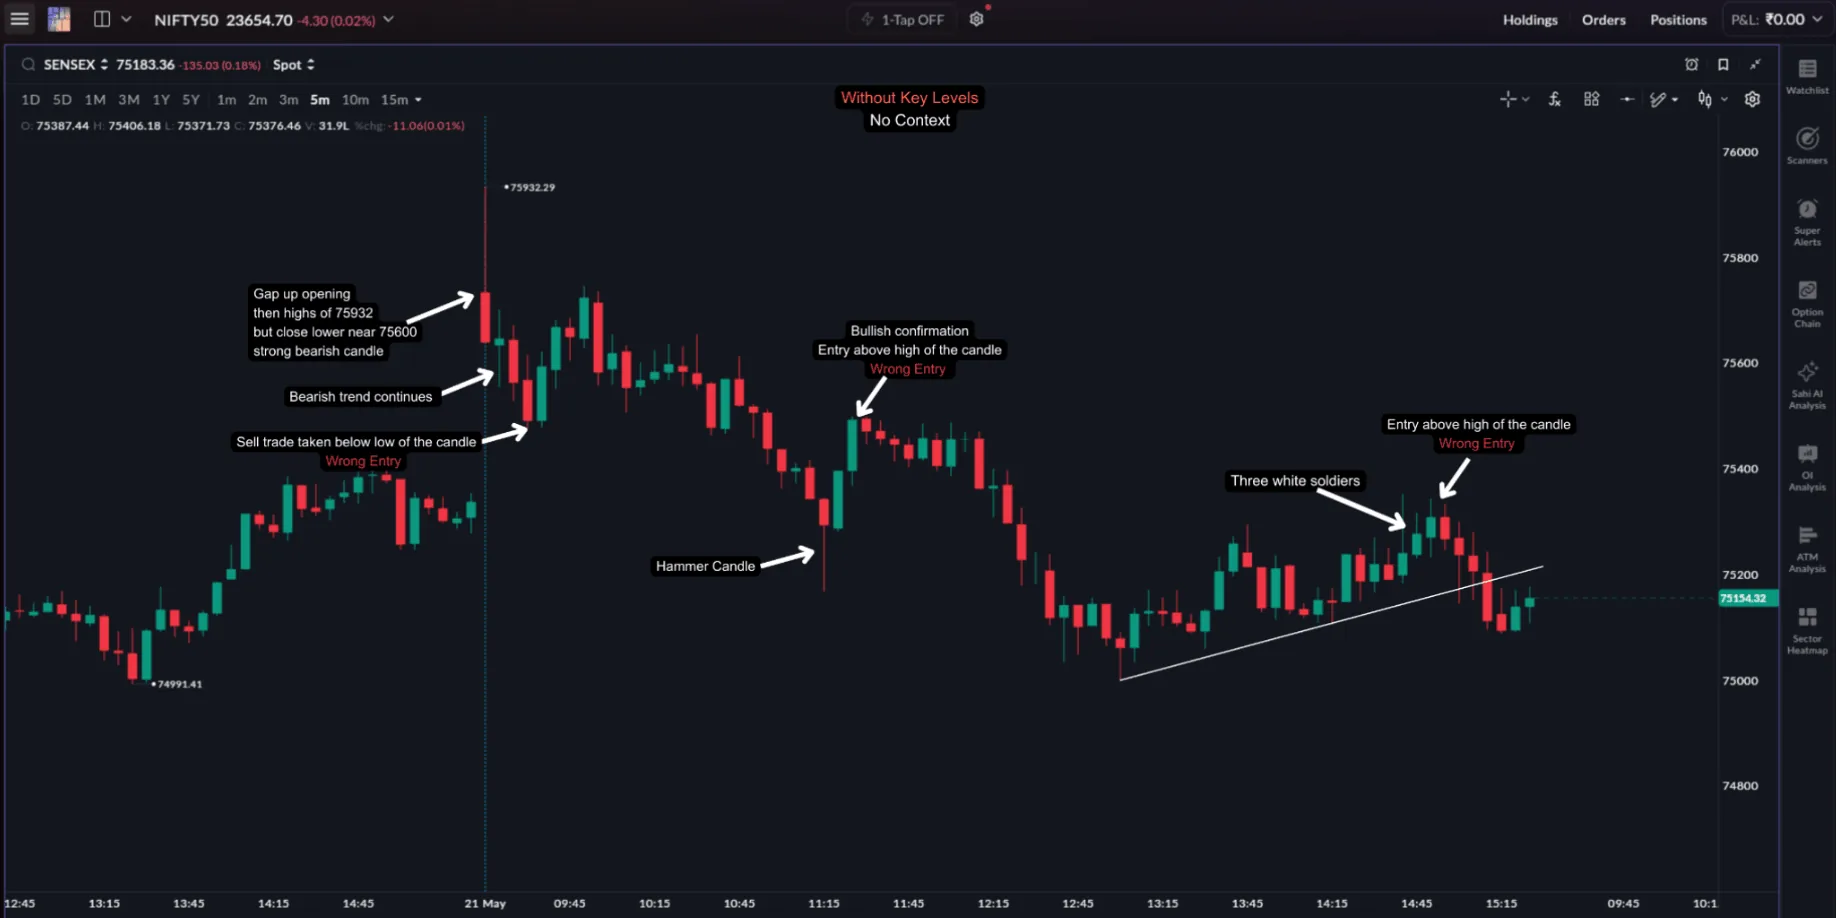
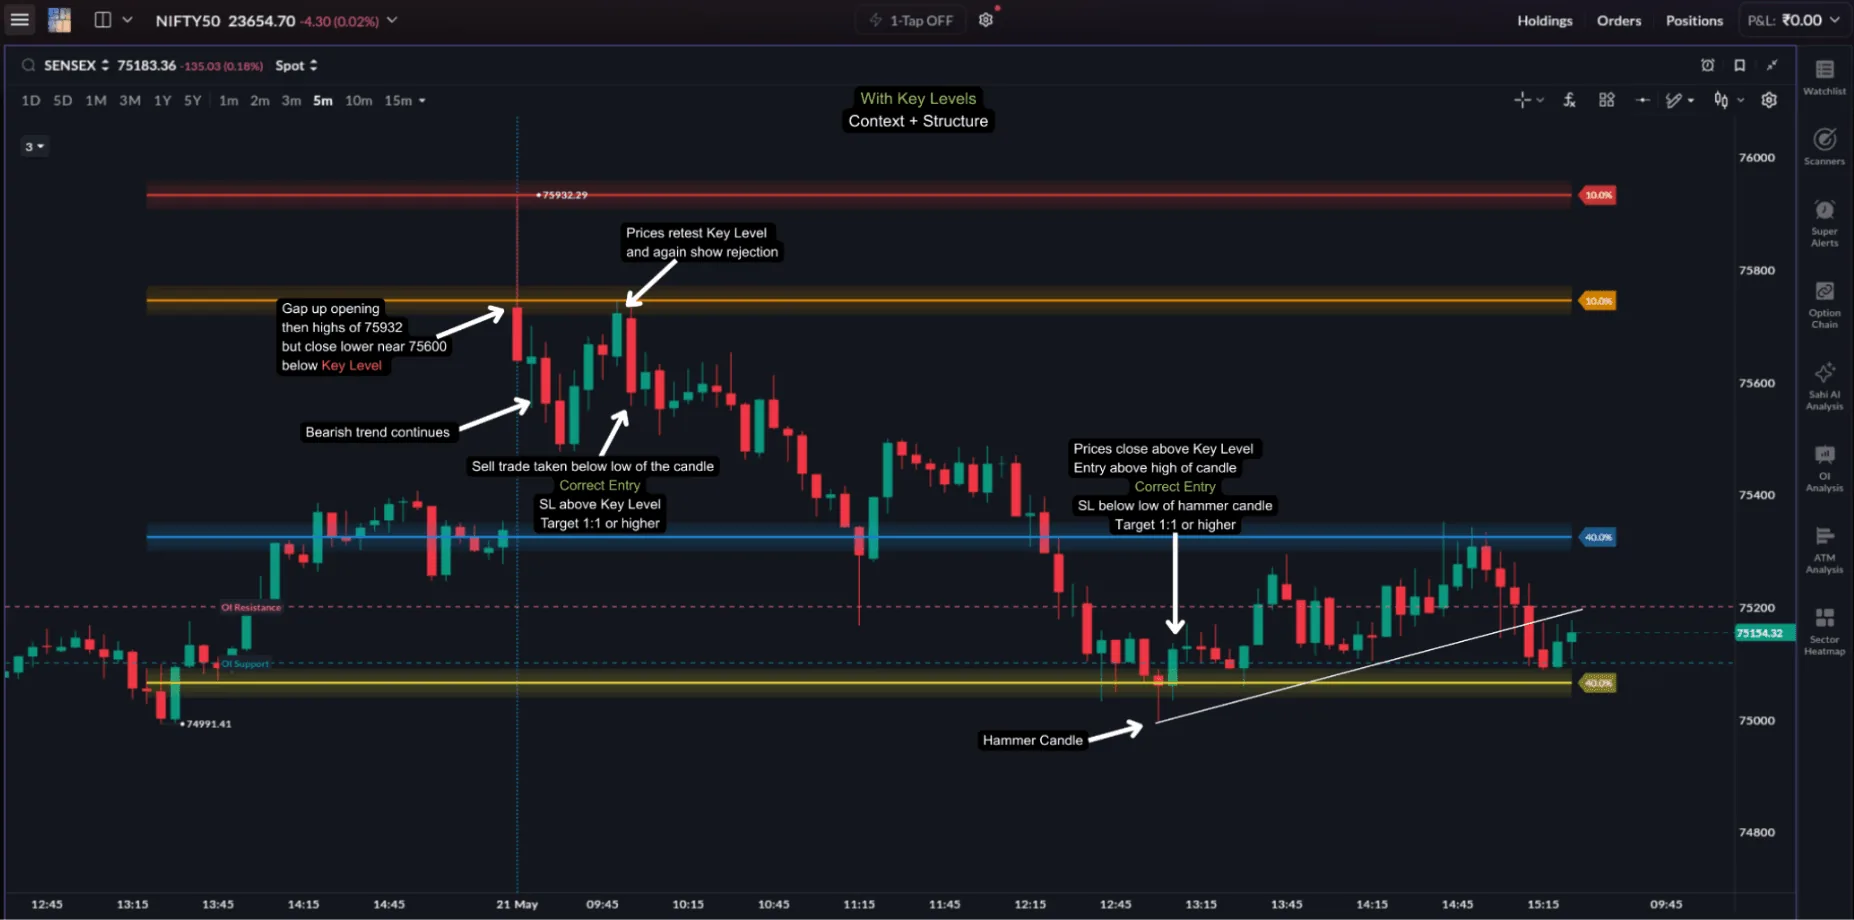
In practice, use levels to plan entries before price arrives, avoid trades in the middle of a range, place stop-losses at logical points, and know where a breakout needs confirmation.
India VIX: how fast is today?
Even with the right levels, a trade behaves differently depending on how fast the market is moving. In India this is often tracked through India VIX, an index computed by NSE from Nifty option prices that reflects the market's expectation of near-term volatility. India VIX does not tell you direction. It tells you how fast or slow conditions may be.
| Lower India VIX | Higher India VIX | |
|---|---|---|
| Price movement | Slower, narrower intraday ranges | Larger swings, wider candles, sharper moves |
| Premium response | Weaker expansion; theta has more time to work | Premiums move faster, in both directions |
| Targets | Realistic, smaller targets | Targets can be reached faster |
| Stop-loss | Tighter placement may work | Slightly wider stops, with smaller quantity to keep the rupee risk the same |
| Approach | Patience and tight execution | Quick execution and strict exits |
For a scalper, India VIX answers one question before the session: how aggressive or how cautious should today's trading be?
Vega: when expectation moves the premium
Chapter 5 introduced vega: the change in premium for a one-point change in implied volatility (IV). Even if price stays where it is:
- Rising IV increases premiums. The expected range widens, so both calls and puts gain value.
- Falling IV reduces premiums. As uncertainty fades, both calls and puts lose value, even without a big price move.
A simple example
Assume Nifty is at 24,000, for illustration.
| Calm market | Before a big event | |
|---|---|---|
| Nifty | 24,000 | 24,000 |
| Range traders expect | 23,900 to 24,100 | 23,600 to 24,400 |
| Implied volatility | Lower | Higher |
| Call and put premiums | Moderate | Both higher |
Before an RBI policy announcement or a major global event, the market expects a wider range. A larger expected move raises the chance that more strikes end in the money. Put writers at 23,800 worry about a sharp fall; call writers at 24,200 worry about a sharp rise. Both sides demand more premium, so premiums rise.
Price has not moved. Expectation has changed. The premium still rises. That is vega. The reverse also holds: once the event is over, IV often falls and premiums drop, even if Nifty is unchanged.
Vega is most visible:
- Around expiry. Premiums swing quickly as expiry approaches and volatility shifts.
- On RBI policy days. Major announcements often bring a quick rise and then a fall in volatility.
- Around events. The Union Budget, company results and major global events create temporary uncertainty that lifts premiums.
Putting the context together
The strongest scalps come when several conditions line up:
- Price structure. An important chart level or SAHI Key Level is in play.
- OI positioning. A heavy call or put OI zone sits at or near that level.
- Volatility. Candles widen and volume rises as buyers and sellers become active at the level.
- Premium reaction. After the candle confirms, the option premium starts responding faster.
Example: a breakout above resistance
- Nifty breaks above an important intraday resistance that also carries heavy call OI, and the candle closes above it on rising volume.
- Call OI at that strike starts to fall (call writers are covering) and put OI builds at the same strike or just below it (writers now expect it to hold as support).
- Candles widen as momentum increases.
- Call premiums expand faster, giving a cleaner execution window. A retest of the broken level that holds is the lower-risk entry.
On the index, implied volatility often eases during a steady rally and rises during a sharp fall. Do not assume IV will help an upside breakout; watch the premium itself.
Common mistakes
- Trading straight into strong OI zones. Buying calls into heavy call OI resistance, or buying puts into strong put OI support, without confirmation.
- Ignoring volatility. Using aggressive momentum methods in a flat, low-volatility session.
- Treating every level equally. Drawing too many levels instead of focusing on the few that matter.
- Acting on a single data point. Entering the moment price touches a level, without waiting for the candle to confirm.
- Forcing trades in quiet markets. Trading in the middle of a flat range with poor structure and weak follow-through.
Market context tells you where reactions and momentum are likely to develop. Chapter 7 moves to execution: using EMA, VWAP, RSI and Bollinger Bands to time entries and manage scalp trades.
Checklist
- Before the open, mark the call OI wall above, the put OI wall below, and the previous day's high and low.
- Expect a reaction at a wall; trade the candle at the wall, not the wall itself.
- A break of a wall is stronger when OI unwinds there, volume rises, and the retest holds.
- Check India VIX to set today's pace: target size, stop width and how long to hold.
- Rising IV lifts premiums; falling IV shrinks them, even if price does not move.
- Skip trades in the middle of the range.
Questions
Are key price levels enough to justify a scalp entry?
No. Levels show where the market's attention is, but you still need confirmation from live price action at the level.
Which matters more, OI zones or chart key levels?
Neither should be traded alone. The stronger setups come when both point to the same zone.
What if price breaks strongly through a major OI level?
This usually means traders are repositioning quickly, which can support continuation. Check that OI at the broken strike is falling and that the retest of the level holds.
Is it a good idea to scalp in the middle of a range?
Usually not. The middle of a flat range tends to give weak direction and poor risk-reward.
Should levels be identified before market open?
Yes. Mapping the important SAHI Key Levels and OI zones before the session helps reduce impulsive trades.
Why does the volume on my Nifty chart come from futures?
The Nifty index itself is not traded, so it has no volume. Traders read volume from Nifty futures, which track the index closely.
Scalping knowledge check
Can you read the market’s context?
Five quick questions on open interest, OI walls, India VIX and vega. See where you stand and pick up an insight along the way. Under 5 minutes
-
Show answer
Answer: B. The total number of live derivative contracts not yet settled or closed OI is the total number of live derivative contracts not yet settled or closed. Where OI piles up at a strike shows where large participants are building and defending positions.
-
Show answer
Answer: C. As resistance: upward movement often slows near it Call writers at that strike lose if price rises above it, so rallies often slow there. Heavy call OI acts as resistance; heavy put OI acts as support. Neither is a guarantee, so wait for the candles to confirm.
-
Show answer
Answer: A. How volatile the market is expected to be, not which direction it will move India VIX reflects expected near-term volatility: how fast or slow conditions may be, not direction. It guides how aggressive or cautious the day’s approach should be.
-
Show answer
Answer: D. Both call and put premiums rise as implied volatility increases That is vega. Rising implied volatility increases the value of both calls and puts because more strikes could end in the money. Price has not moved, but expectation has.
-
Show answer
Answer: C. Alignment of price structure, OI positioning, volatility and premium reaction A key level, OI concentration at that zone, expanding candles and volume, and a premium that confirms. Single signals on their own are far less reliable.
You got 0 of 5 right.