

A scalper often has a few seconds to decide whether a move is building, slowing or failing. Indicators can make that decision faster, but only if you use them in the right order: first read price (the level, the candle, the volume), then ask the indicator whether it agrees. This chapter covers the five indicators scalpers use most: EMA, VWAP, RSI, Bollinger Bands and ATR.
What indicators can and cannot do
Indicators do not predict direction. Every one of them is calculated from price (and sometimes volume) that has already printed, so it always arrives after price. What they do well is organise information around four questions:
- Trend: which way is the short-term move? (EMA)
- Momentum: is the move getting stronger or weaker? (RSI)
- Volatility: how fast and how far is price moving? (Bollinger Bands, ATR)
- Participation: is volume supporting the move? (VWAP, and OI on SAHI)
Price is the signal. An indicator is a second opinion. Mark the support, resistance or breakout level first, wait for the candle, and only then ask whether the indicators agree. If price structure breaks, the trade is wrong, however good the indicators look.
The instrument cluster
Think of indicators like the dials in a car. Each dial shows one thing, and you read them together:
- Speedometer = momentum (RSI): how strong the current push is.
- RPM meter = volatility (Bollinger Bands, ATR): how aggressively the market is moving.
- Fuel gauge = participation (VWAP, OI): whether enough volume and positioning stand behind the move.
The road itself is price action. No dial tells you where the road turns.
Three rules
- Keep the setup simple. Two or three indicators that answer different questions. Too many create conflicting signals and slow you down.
- Indicators confirm; they do not guarantee. They add structure, not certainty.
- Price is the final authority. If indicators show strength but price breaks its structure, follow price.
EMA: short-term trend and pullbacks
An EMA (Exponential Moving Average) is an average of recent closes that gives more weight to the latest candles. It reacts faster than a simple moving average, which suits short-term trading. For a scalper it answers one question: is the market trending right now, and which way?
Most intraday scalpers use the 9 EMA (fast) and the 20 EMA (slow); some use 21 instead of 20, and the difference is negligible. Some also add the 50 EMA to see the broader intraday structure. The exact numbers matter less than using the same ones every day.
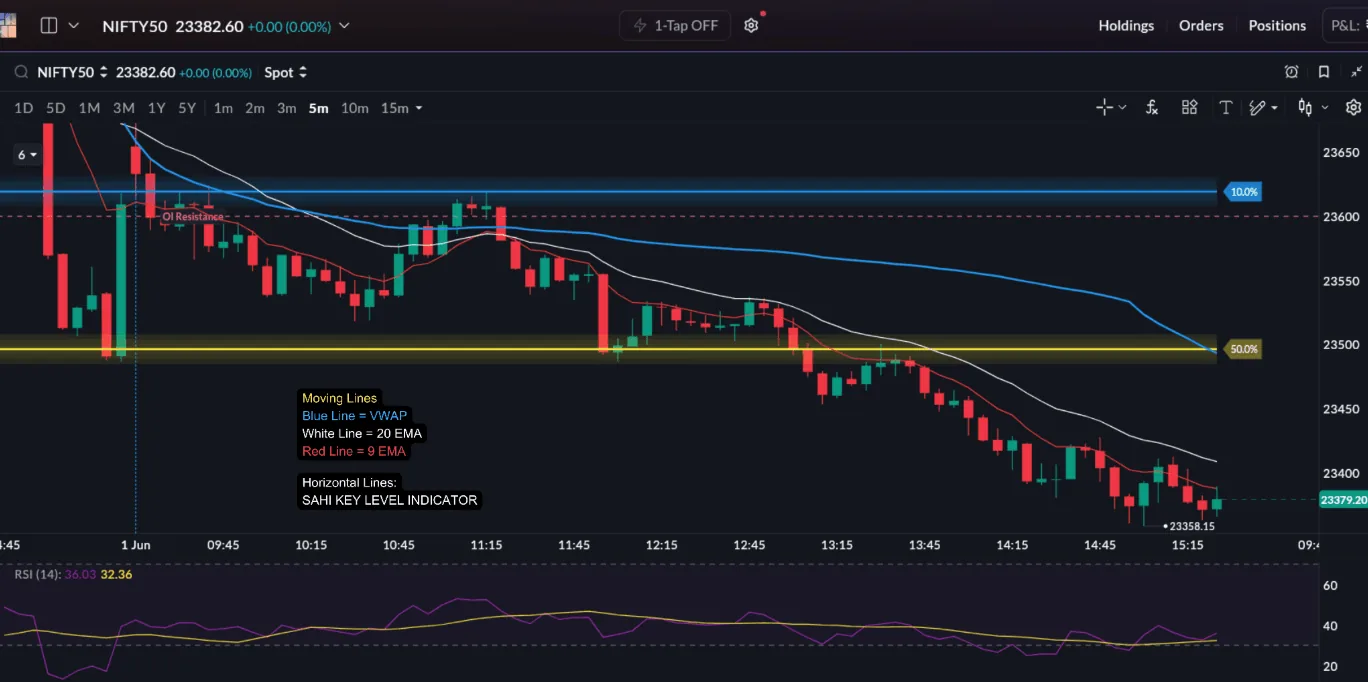
EMA as moving support and resistance
In a trend, price often reacts at the EMAs instead of at fixed horizontal levels. Because the EMA moves with price, it is called dynamic support or resistance. In an up-move, pullbacks to the 9 or 20 EMA may attract buyers; in a down-move, rallies into them may meet sellers.
The cleaner continuation entries come when price pulls back into the EMA zone, the pullback candles get smaller on lighter volume, and a candle then closes back in the direction of the trend. This gives a tighter stop than chasing an extended candle.
EMA alignment
| What the EMAs show | Market condition | Scalper's bias and action |
|---|---|---|
| 9 EMA above 20 EMA, both sloping up | Bullish momentum | Prefer longs. Buy pullbacks into the 9 to 20 EMA zone. Avoid shorting against the move. |
| 9 EMA below 20 EMA, both sloping down | Bearish structure | Prefer shorts. Sell rallies into the 9 to 20 EMA zone. Avoid counter-trend buying. |
| EMAs flat and crossing again and again | Sideways, choppy | No bias. Skip trend-following setups; trade less, or trade the range edges only. |
Crossovers
The 9 EMA crossing above the 20 EMA can support a bullish move, and crossing below can support a bearish one. On its own, a crossover is a poor scalp signal: it is late in a trend and frequent in a range. Use it only to confirm a break of a price level.
Taking every EMA touch as a trade, trading crossovers without a price level behind them, and using EMAs at all in a flat, sideways session.
VWAP: the day's fair price
VWAP (Volume Weighted Average Price) is the average price traded so far today, weighted by volume. It starts fresh with the first candle of each session. Large participants watch it closely because it shows where most of the day's trading has taken place.
For a scalper, VWAP is a bias filter. Price holding above VWAP reflects a stronger intraday structure; price holding below it, a weaker one. It is not a buy or sell signal by itself. What matters is how price behaves when it reaches VWAP.
Three behaviours to watch
- Reclaim. Price trades below VWAP, then closes back above it with momentum and rising volume. Buyer participation is improving.
- Rejection. Price tries to get above VWAP and fails again and again. Buying pressure is weak, and the bearish structure may continue.
- Rotation. On a quiet, low-volatility day, price swings around VWAP instead of trending, and breakouts often fail. Here a move stretched far from VWAP, slowing momentum and a reversal candle at the extreme can offer a mean-reversion scalp back towards VWAP.
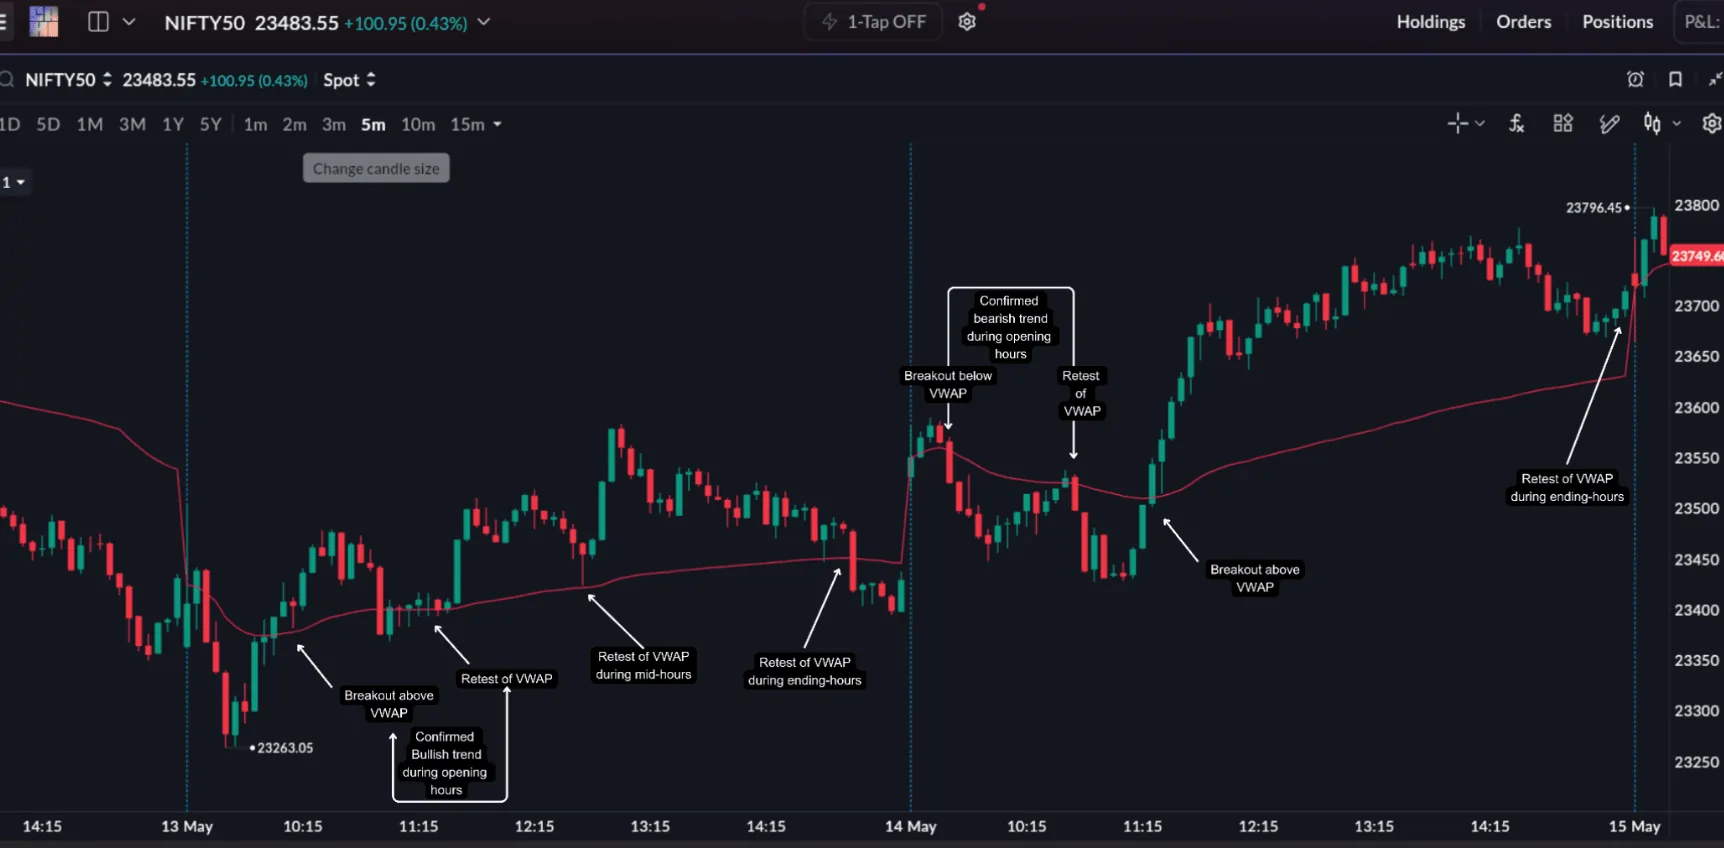
Buying only because price is above VWAP or selling only because it is below, treating VWAP as a guaranteed reversal point, and trusting VWAP in the first few candles, when it is built from very little data.
EMA and VWAP on one session
Here is one sample 3-minute index session with VWAP, the 9 EMA and the 21 EMA. Read the numbered points from left to right and notice that price acts first at every step.
- Up
- Down
- VWAP
- 9 EMA
- 21 EMA
- Range high
- Opening range
- Opening range: no trade. For the first 18 candles price swings inside a range of less than 70 points and crosses VWAP nine times. The EMAs are flat and tangled. The 9 EMA even crosses above the 21 EMA two candles before the breakout, while price is still inside the range: a crossover with no level behind it.
- Price breaks first. Candle 22 closes about 60 points above the range high on the tallest volume bar of the session. Price is now above VWAP and the 9 EMA turns up sharply. The indicators confirm what the candle has already said.
- Pullback into the EMA zone. About 12 candles later price dips into the gap between the two EMAs. The lowest candle holds above the 21 EMA, and its volume bar is the smallest of the session. Sellers are not pressing.
- Continuation entry. Three candles later a candle closes above the highs of the pullback with about twice the average volume of the pullback candles. This is the trend-and-pullback entry, with the stop below the pullback low.
- Trend tires. After the high at candle 49, price moves sideways for about 30 candles and the EMAs flatten. At candle 75 the 9 EMA slips under the 21 EMA, yet price is still about 60 points above VWAP and inside a range. This crossover is not a short signal; it is a sign to stop taking pullback trades.
RSI: is momentum building or fading?
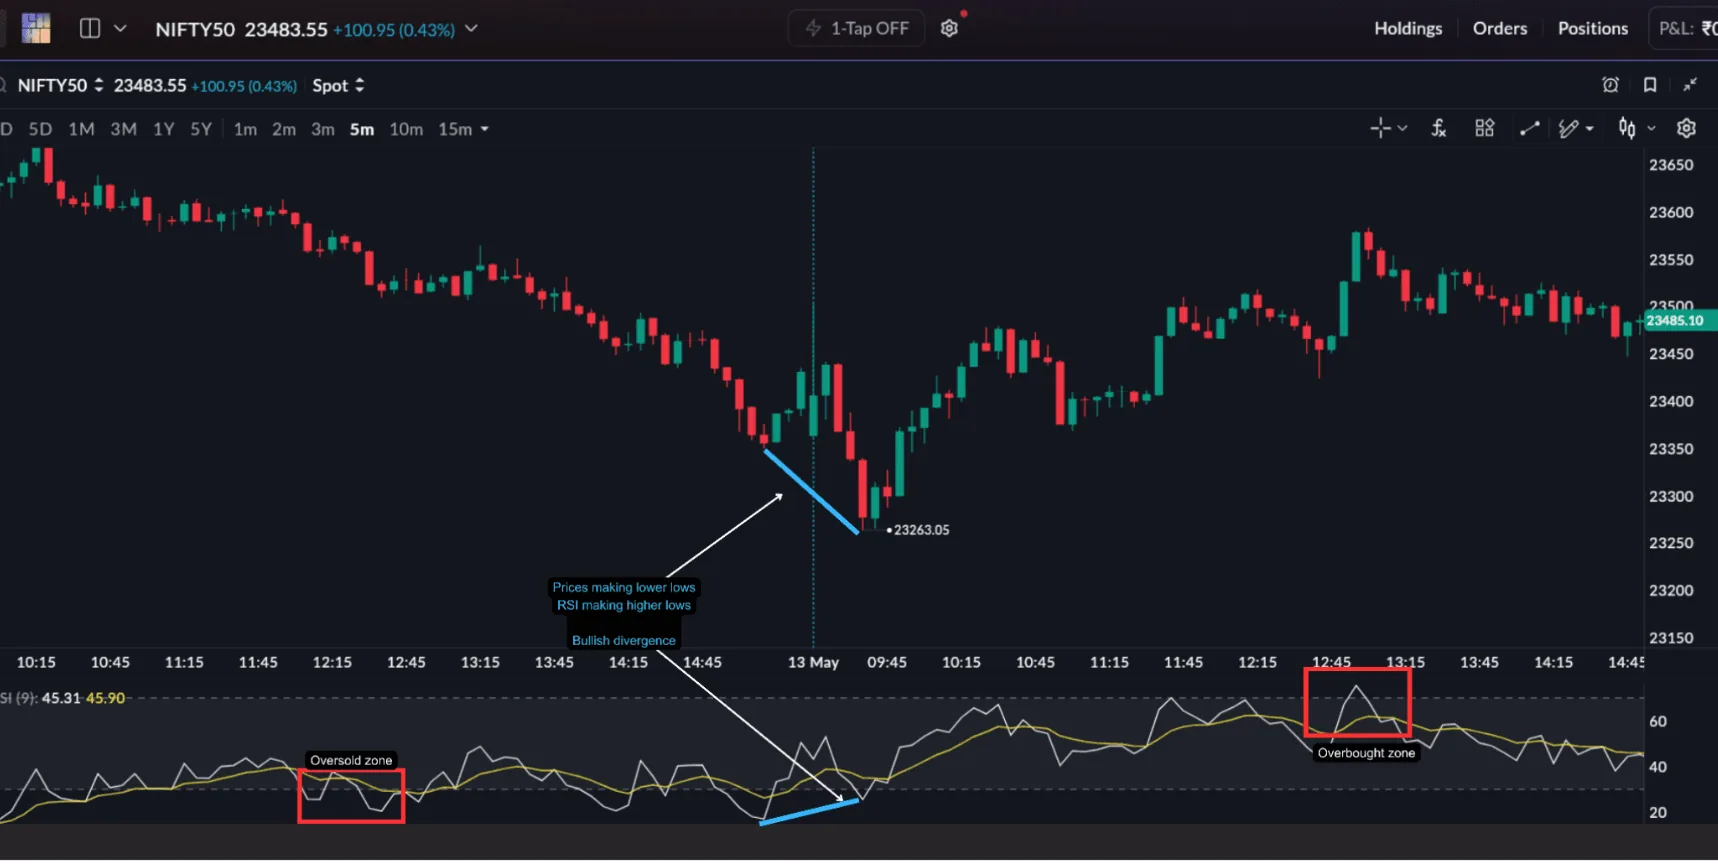
RSI (Relative Strength Index) compares the size of recent up-closes with recent down-closes and shows the result on a scale of 0 to 100, in a pane below the chart. Readings above 70 are usually called overbought and below 30 oversold.
Many beginners read this as "overbought means sell, oversold means buy". That rule fails exactly when scalping is most profitable: in a strong trend, RSI can stay overbought or oversold for a long time. Use RSI to judge the strength of a move that price has already started, not to call a top or bottom.
| What RSI shows | What it suggests | How to use it |
|---|---|---|
| Holding above 60 | Bullish momentum continuing | Supports long breakouts and pullback buys |
| Holding below 40 | Bearish momentum continuing | Supports short breakdowns and rally sells |
| Above 70 or below 30 | Strong, possibly stretched move | Do not fade it on this alone; avoid chasing new entries |
| Price lower low, RSI higher low (bullish divergence) | Selling momentum weakening | Watch for a reversal candle at support |
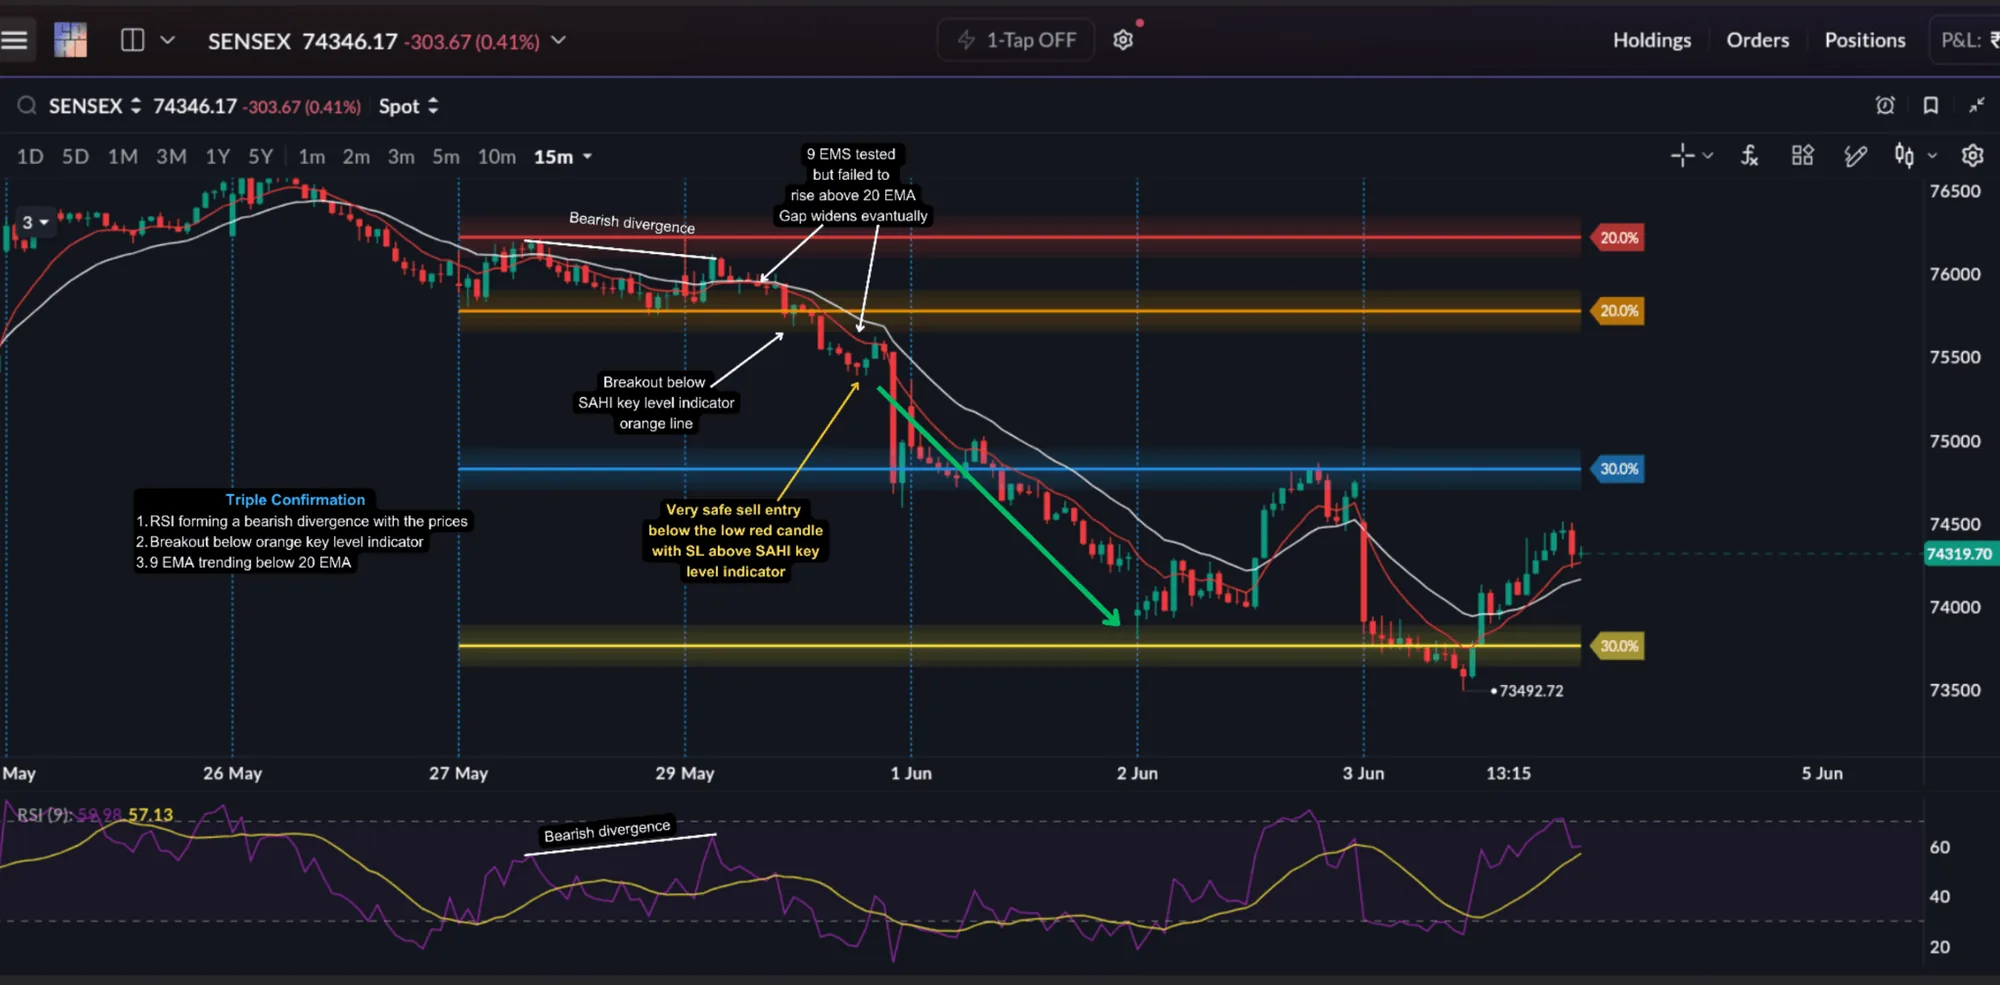
| Price higher high, RSI lower high (bearish divergence) | Buying momentum weakening | Watch for a rejection or a break of support |
Divergence does not guarantee a reversal. It only says the push is weakening. Act on it only when price confirms, for example with a close back above a broken support or below a broken trendline.
Bollinger Bands and ATR: how far price can move
Bollinger Bands
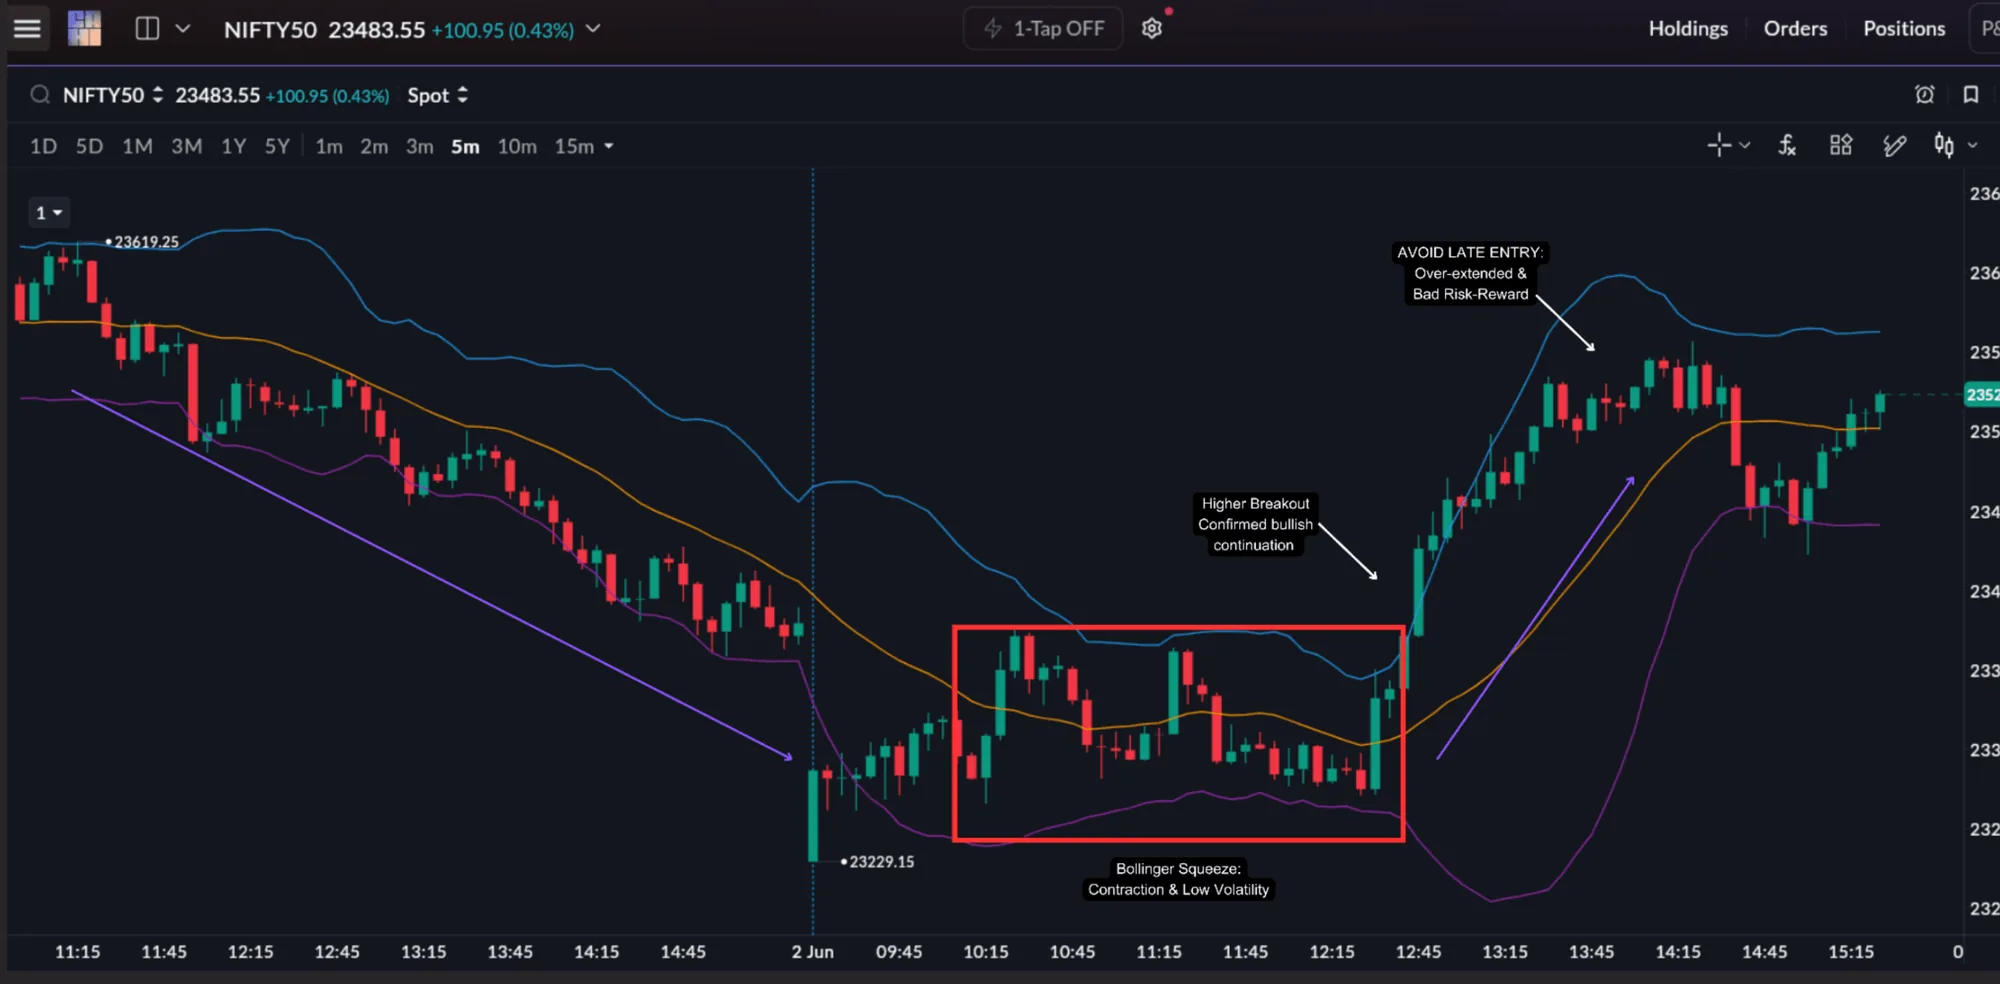
Bollinger Bands are three lines: a middle moving average with an upper and a lower band around it. The bands widen when volatility rises and narrow when it falls. Common settings use a 20-period average with the bands two standard deviations away.
- Squeeze. The bands contract tightly; volatility is low and price is compressing, often in a small range. A larger move often follows, but the squeeze does not tell you which way.
- Expansion. Once price breaks out of the squeeze, candles get bigger, momentum rises and option premiums may expand faster.
- Late entries. By the time the bands have already opened wide, premiums may be inflated, risk-to-reward is worse and a pullback is more likely.
So the price action rule is: mark the high and low of the small range inside the squeeze, and act only on a candle that closes beyond one of them, ideally with a clearly taller volume bar.
ATR
ATR (Average True Range) measures how much price normally moves per candle over a recent period. It has no direction. It tells you the size of the market's normal noise, which is what you need to set a stop and a target.
- Higher ATR: wider candles, larger swings, faster movement. Stops must be wider and size smaller.
- Lower ATR: narrow candles and tight ranges. Large targets are unrealistic.
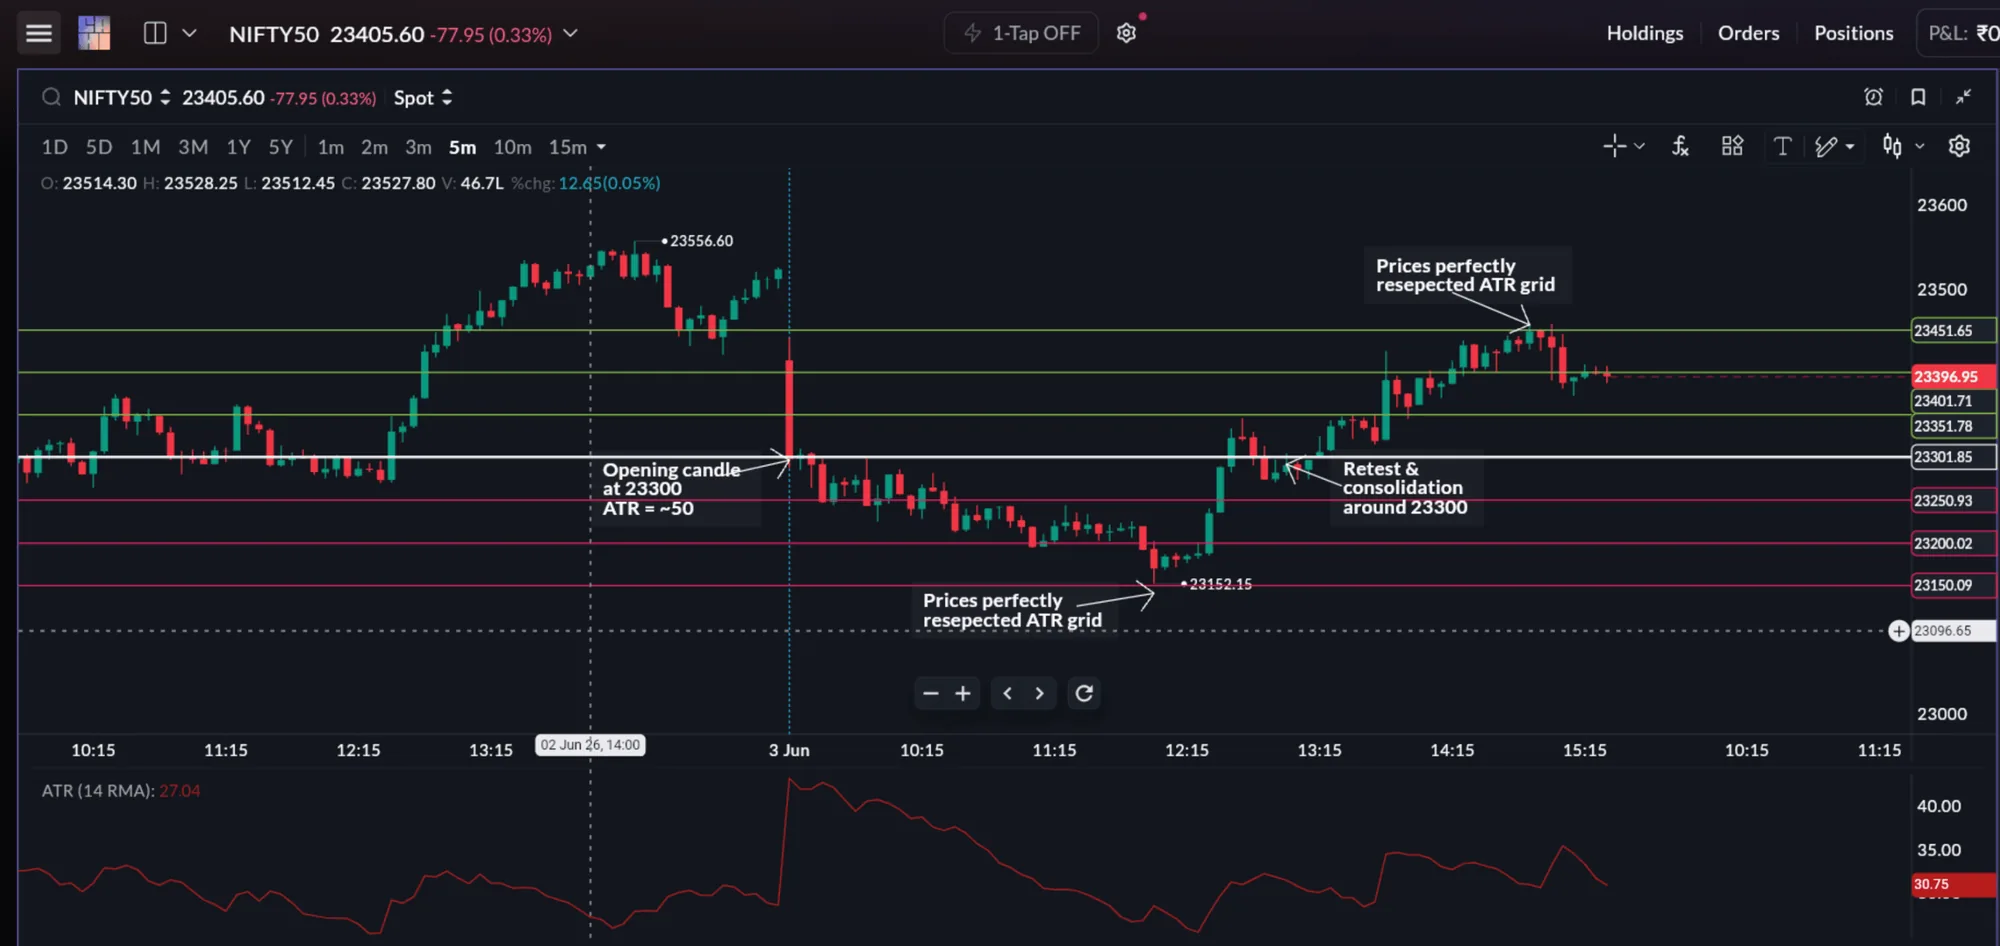
Some traders draw an ATR grid: lines at multiples of ATR (for example 1.0x, 1.5x and 2.0x) above and below the opening price. These levels often act as expansion targets, exhaustion zones and reaction areas, and show how much movement is reasonable for the day.
Opening price 23,300, ATR about 50 points1.0x ATR: 23,350 and 23,250 · 1.5x ATR: 23,375 and 23,225 · 2.0x ATR: 23,400 and 23,200
If price has already travelled 2x ATR from the open, a fresh breakout buy has much less room left than the same setup near the open.
Assuming every squeeze breaks out, fading a strong trend just because price touches an outer band, using the same stop-loss every day whatever the ATR, and expecting large targets on a low-ATR day.
SAHI's own chart tools
Alongside the standard indicators, SAHI builds price structure, option positioning and volatility tools into the chart, so you do not have to switch between screens.
- Key Level indicator. Marks support zones, resistance zones, breakout areas and reaction levels automatically. This reduces clutter and drawing bias.
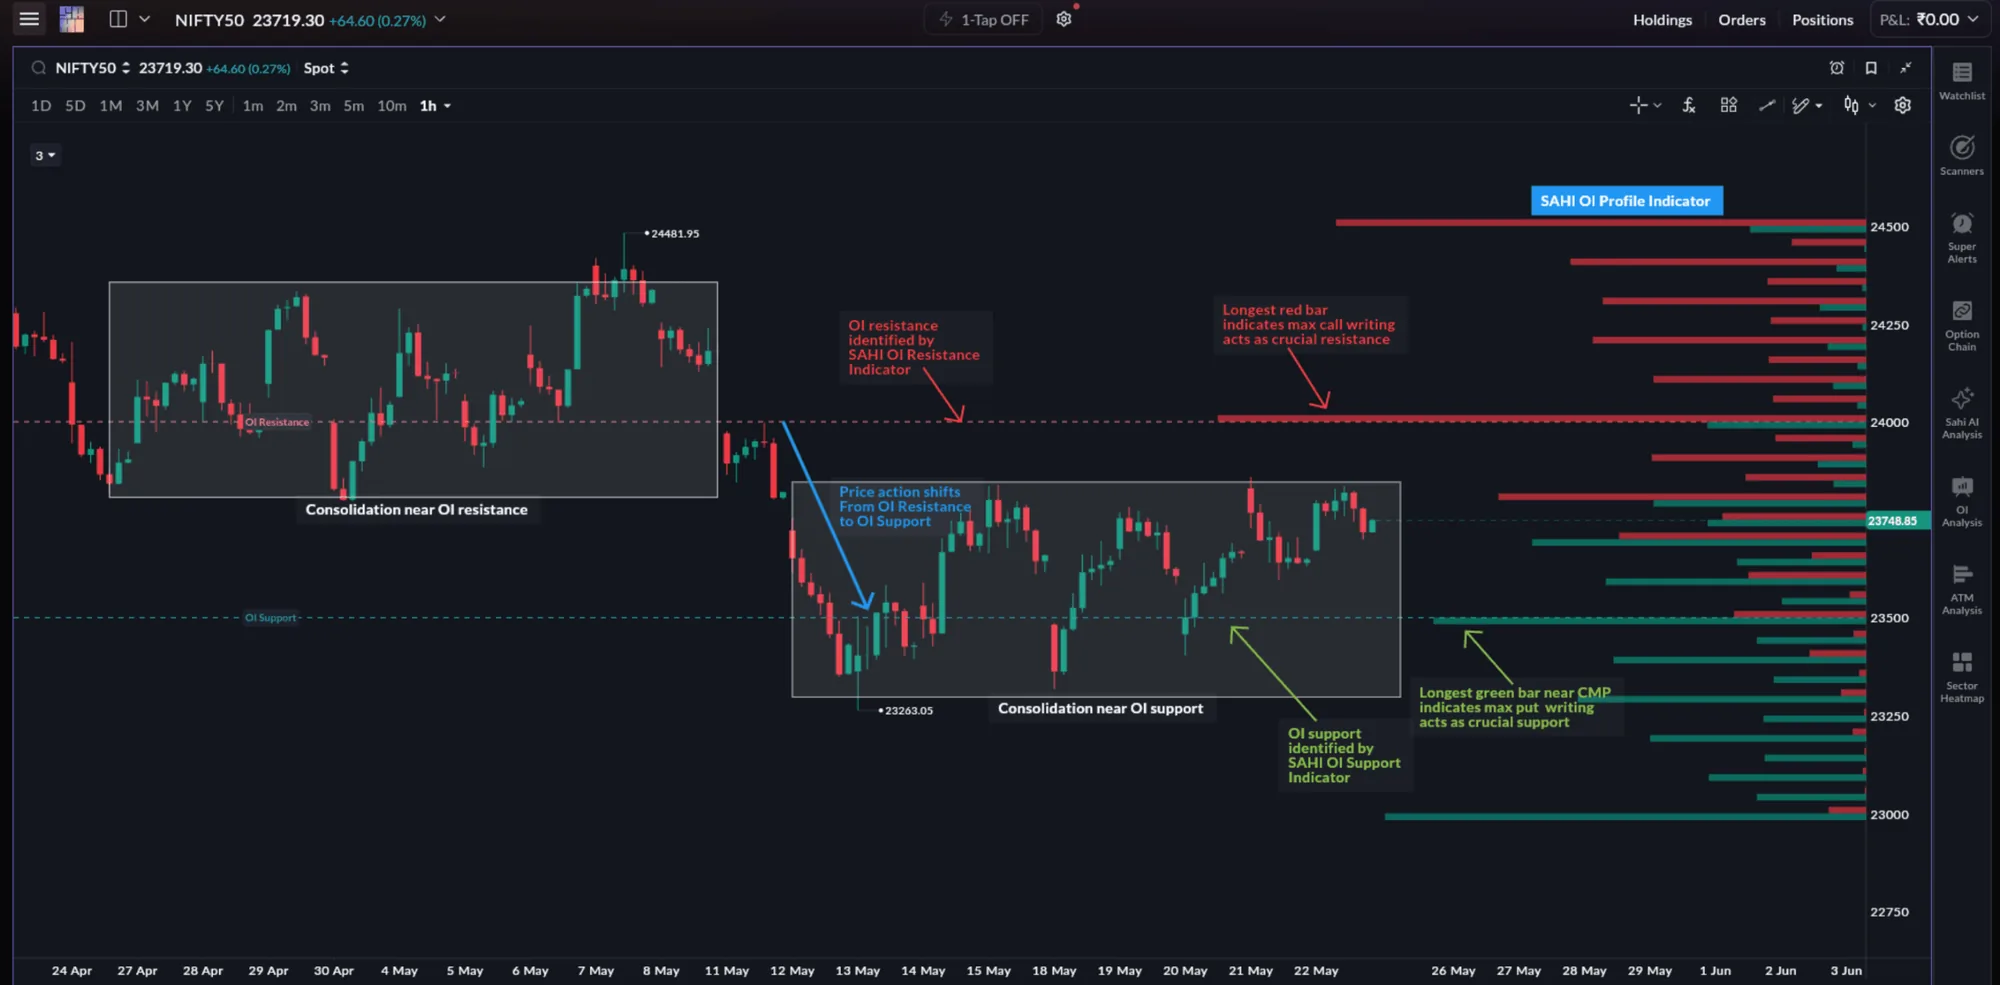
- OI Support & Resistance. Combines option positioning with price structure: heavy Call OI may act as resistance and heavy Put OI as support.
- OI Profile. Shows where open interest is concentrated by strike, so you can see the active zones for the session.
- Max Pain. Highlights the expiry-related level where option writers may try to pin price. It matters most on expiry days, in low volatility and in range-bound markets.
Putting it together
Indicators are most useful when they agree with price and with each other. A strong long scalp usually lines up like this:
- Price: a candle closes above resistance, on a clearly taller volume bar.
- VWAP: price is, and stays, above VWAP.
- EMA: the 9 EMA is above the 20 EMA and both slope up.
- RSI: momentum strengthens above 60.
- Volatility: the bands start to expand from a squeeze, not after they are already wide.
- OI: positioning supports the move; there is no heavy Call OI wall just above.
Each line removes weaker trades. But waiting for every possible confirmation also has a cost: by the time six things agree, the move may be half over. Two or three confirmations that answer different questions are enough.
What each indicator answers, and when it misleads
| Indicator | Question it answers | Confirms price when | Misleads when |
|---|---|---|---|
| EMA 9 / 20 | Which way is the short-term trend? Where is the pullback zone? | Price breaks a level and pullbacks hold the EMA zone | The session is sideways and the EMAs are flat and crossing |
| VWAP | Are buyers or sellers in control today? | A breakout holds on the right side of VWAP | The first few candles; range days with repeated crosses |
| RSI | Is momentum building or fading? | RSI holds above 60 (or below 40) during a breakout; divergence at a key level | Overbought is read as "sell" or oversold as "buy" in a strong trend |
| Bollinger Bands | Is volatility contracting or expanding? | A squeeze ends with a close beyond the small range on volume | An outer-band touch is treated as a reversal; entry comes after the bands are already wide |
| ATR | How far does price normally move? | Stops and targets are sized to the current range | ATR multiples are treated as guaranteed targets; ATR has no direction |
Common mistakes with indicators
- Using indicators without a price level or structure behind them.
- Using too many indicators at once, so they contradict each other.
- Waiting for so many confirmations that the entry comes late.
- Ignoring volatility conditions.
- Following crossovers and overbought or oversold readings blindly.
- Treating indicators as prediction tools instead of confirmation tools.
The aim is not to find more signals. It is to filter out weaker setups. Indicators should simplify execution, not complicate it.
Even a well-confirmed setup can fail, through late entry, emotional decisions or poor risk management. The next chapter walks through those failure scenarios one by one.
Checklist
- Read price first: level, candle close, volume. Then check the indicators.
- Use two or three indicators that answer different questions: trend (EMA), control (VWAP), momentum or volatility (RSI, Bands, ATR).
- Best EMA and VWAP trade: a breakout above VWAP, then a light-volume pullback into the 9 to 20 EMA zone that holds.
- Overbought is not "sell" and oversold is not "buy" in a strong trend.
- Size stops and targets to ATR; do not expect big targets on a quiet day.
- Flat, crossing EMAs and repeated VWAP crosses mean a range: trade less.
Questions
Which indicator is most useful for scalping?
There is no single best indicator. Most scalpers combine a trend tool (EMA), a bias tool (VWAP) and a momentum or volatility tool (RSI, Bollinger Bands or ATR), and use all of them to confirm price action rather than replace it.
Should I use multiple indicators together?
Yes, but only when each one answers a different question. Several indicators that measure the same thing create conflicting signals and slower decisions.
Is an EMA crossover enough to enter a trade?
No. A crossover works better as confirmation of a price break. Inside a range, crossovers happen often and mean little; price structure and context matter more.
Why does RSI stay overbought during strong trends?
Strong momentum keeps recent up-closes much larger than down-closes, so RSI can stay high for a long time. Overbought does not automatically mean a reversal.
Why is VWAP important in intraday trading?
VWAP shows the day's average traded price, weighted by volume, so it marks where most of the session's participation has taken place. That makes it useful for intraday bias and for mean-reversion moves on quiet days.
Can indicators predict the market?
No. Indicators are calculated from prices that have already printed. They help organise information and improve execution, but they do not predict the next move.
Chapter 7 check
Test yourself: indicators for scalping
Five quick questions on EMA, VWAP, RSI and Bollinger Bands in live scalping. Under 3 minutes
-
Show answer
Answer: C. To organise information around trend, momentum, volatility and participation. Indicators do not predict direction or guarantee outcomes. They help you confirm what price structure is already showing.
-
Show answer
Answer: A. Bullish momentum: buying pullbacks into the EMA zone is preferred. A rising 9 EMA above a rising 20 EMA reflects bullish momentum. Scalpers prefer longs and buy pullbacks into the EMA zone rather than shorting against the move.
-
Show answer
Answer: D. Improving buyer participation and strengthening intraday momentum. A VWAP reclaim with momentum often means buyers are taking control. It is a shift to act on with price confirmation, not a guaranteed signal.
-
Show answer
Answer: B. Strong trends can keep RSI overbought or oversold for long periods. That is why RSI works as a confirmation of momentum alongside price structure, not as an automatic reversal signal.
-
Show answer
Answer: C. Low volatility that may come before a larger move, with direction still needing confirmation. A squeeze shows compression. The direction comes from price: a candle that closes beyond the small range, ideally on higher volume.
You got 0 of 5 right.