

Scalp trades usually fail because of execution mistakes, weak context, poor strike selection or a change in market conditions, not because the idea was bad. This chapter takes the most common failures one at a time. Each ends with a scenario card: what happened, why it failed, and the fix.
Why scalp trades fail
A common belief is that every losing trade comes from a bad setup. In practice the setup is only one part of the outcome. Trades usually fail when several things work against you at the same time:
- poor execution at entry or exit;
- hesitation that leads to late decisions;
- weak market context before entry;
- chasing price after the move has already started;
- ignoring price action, support and resistance, OI or the risk structure of the trade.
Most of these failures are within your control. A loss that follows your plan is a cost of trading. A loss that breaks your plan is a mistake, and mistakes can be found early and removed.
Entry mistakes: the late chase and the trap
Scenario 1: Chasing a breakout late
Breakouts are among the most popular scalping setups, and among the most mismanaged. A breakout entry is valid near the start of the move. Once price has already run far from the level, it is no longer a breakout entry; it is a chase. In options this costs even more, because much of the premium expansion has already happened.
- Up
- Down
- VWAP
- Breakout level
- Range
- The real breakout. After 20 candles in a range, candle 21 closes about 40 points above the range high on the tallest volume bar of the session. This is where the breakout entry was.
- The chase. Five candles later price is near 25,150, about 108 points above both the breakout level and VWAP. A trader who hesitated now buys here. With a 30-point stop, the stop is hit four candles later.
- The retest. Price pulls back to the breakout level, which is also near VWAP, on light volume. The old resistance holds as support.
- The better entry. Two candles later a candle closes up from the retest on about three times the volume of the candle before it. The stop goes below the retest low, about 30 points away.
- Right direction, wrong entry. Price makes a new high above the chaser's entry. The chaser was right about direction and still lost; the retest trader risked the same 30 points for a much larger move.
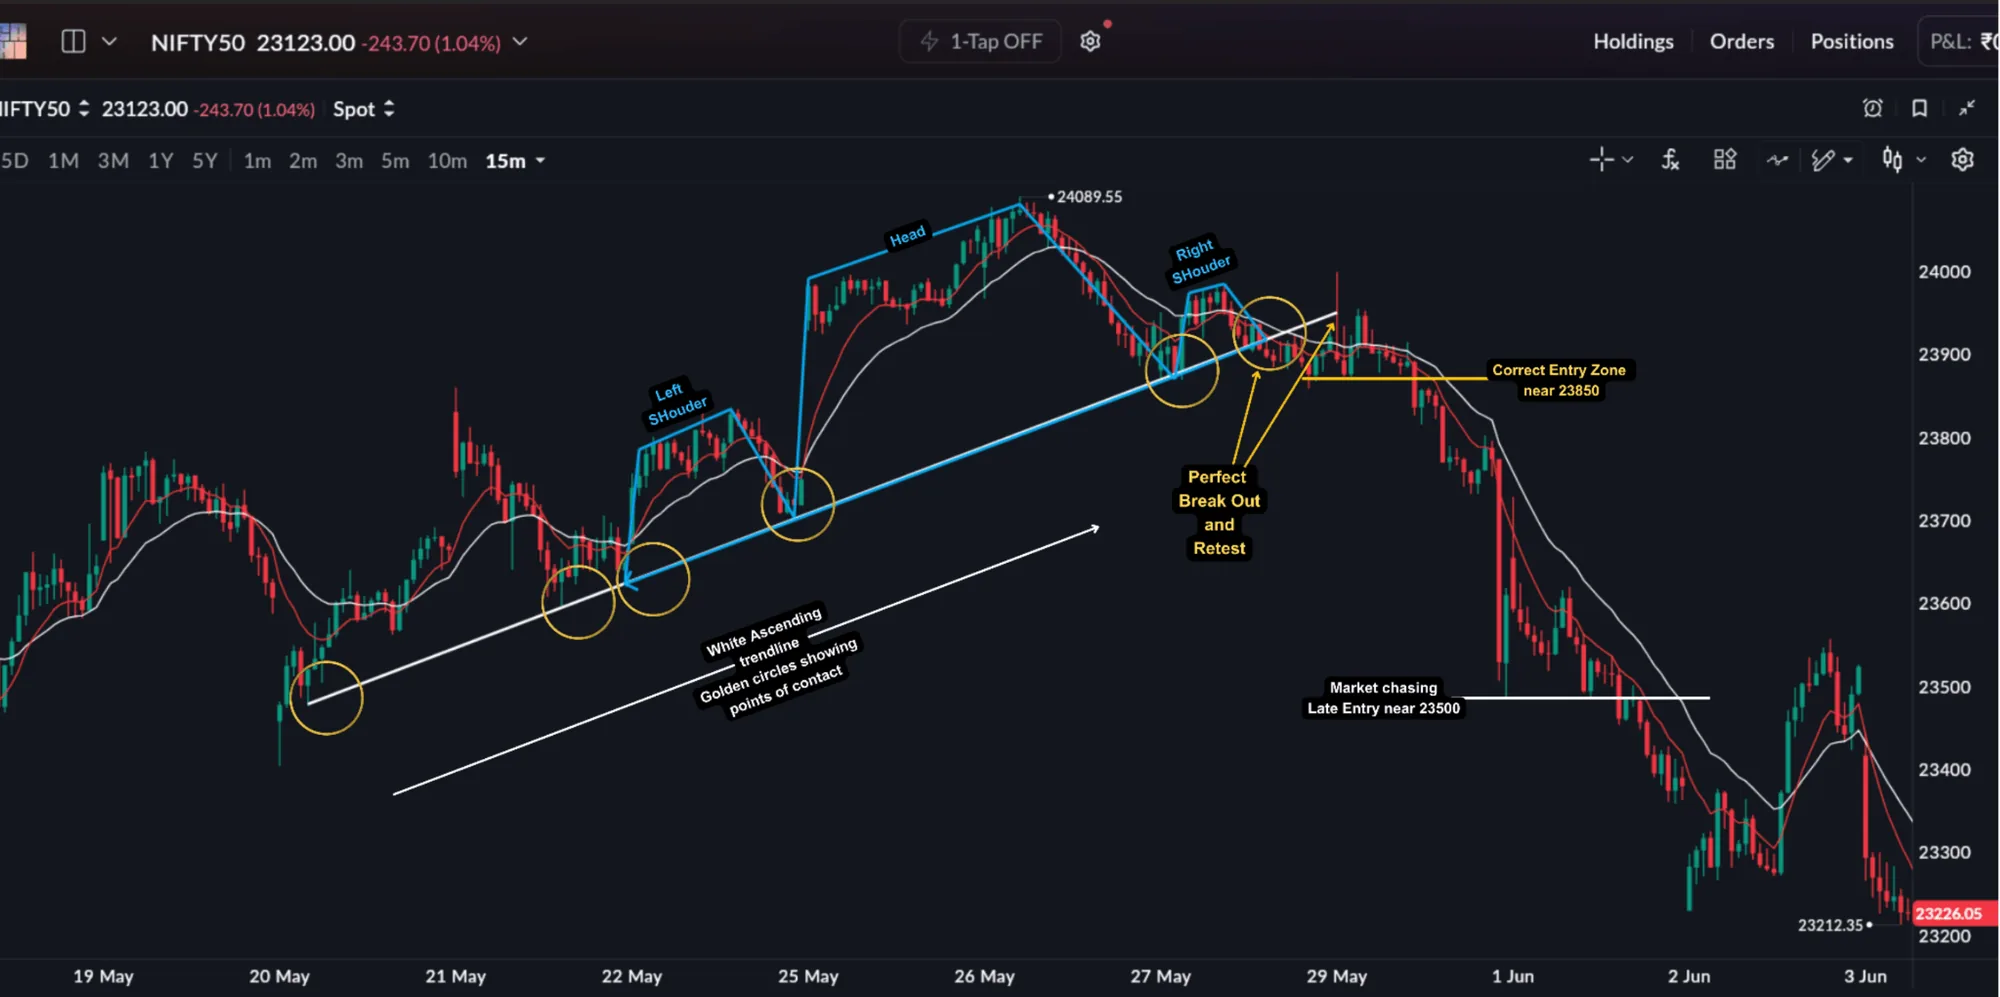
What happened. You watched the breakout form, hesitated, and entered only after the move looked obvious.
Why it failed. The stop had to be larger and the remaining reward was smaller. The option premium was already inflated, and a normal pullback was more likely.
The fix. Enter near the level or wait for the retest. If price is already far from the level and from VWAP, let it go. A good setup becomes a poor trade when it is entered too late.
Scenario 2: The failed breakout (the trap)
Sometimes the breakout itself is false. Price closes just beyond the level, traders rush in, and price falls straight back inside the range. Volume usually gives the warning before the candle closes.
- Up
- Down
- Range high
- Range low
- Range
- The poke. After 24 candles in a range, candle 26 closes about 33 points above the range high.
- Thin volume. The bar under that candle is the smallest of the session. Very few participants joined the move.
- Back inside. Three candles after the breakout, price closes back inside the range. A late buyer who chased the next candle near 25,083 is now nearly 50 points under water, and every buyer above the range high is trapped.
- The real move. Price breaks the range low instead, and the volume bars around this break are the tallest of the session.
What happened. You bought the first close above resistance, on a candle with very little volume behind it.
Why it failed. There was no participation behind the breakout. When it slipped back inside the range, the trapped buyers' stop-losses added fuel to the fall.
The fix. Trust a breakout that closes beyond the level on clearly higher volume and holds for the next one to three candles. Treat a thin-volume breakout as a question, and exit at once if price closes back inside the range.
Context mistakes: OI walls and volatility
Scenario 3: Trading into a strong OI zone
Open Interest (OI) shows where option positions are concentrated. Heavy Call (CE) OI at a strike often acts as resistance and heavy Put (PE) OI as support, because these zones reflect real positions, not just lines on a chart. A trade can look right on the chart while the OI structure works against it: buying a call just below heavy CE OI, or shorting just above heavy PE OI. Near such zones momentum slows, profit booking appears and reversals become more likely.
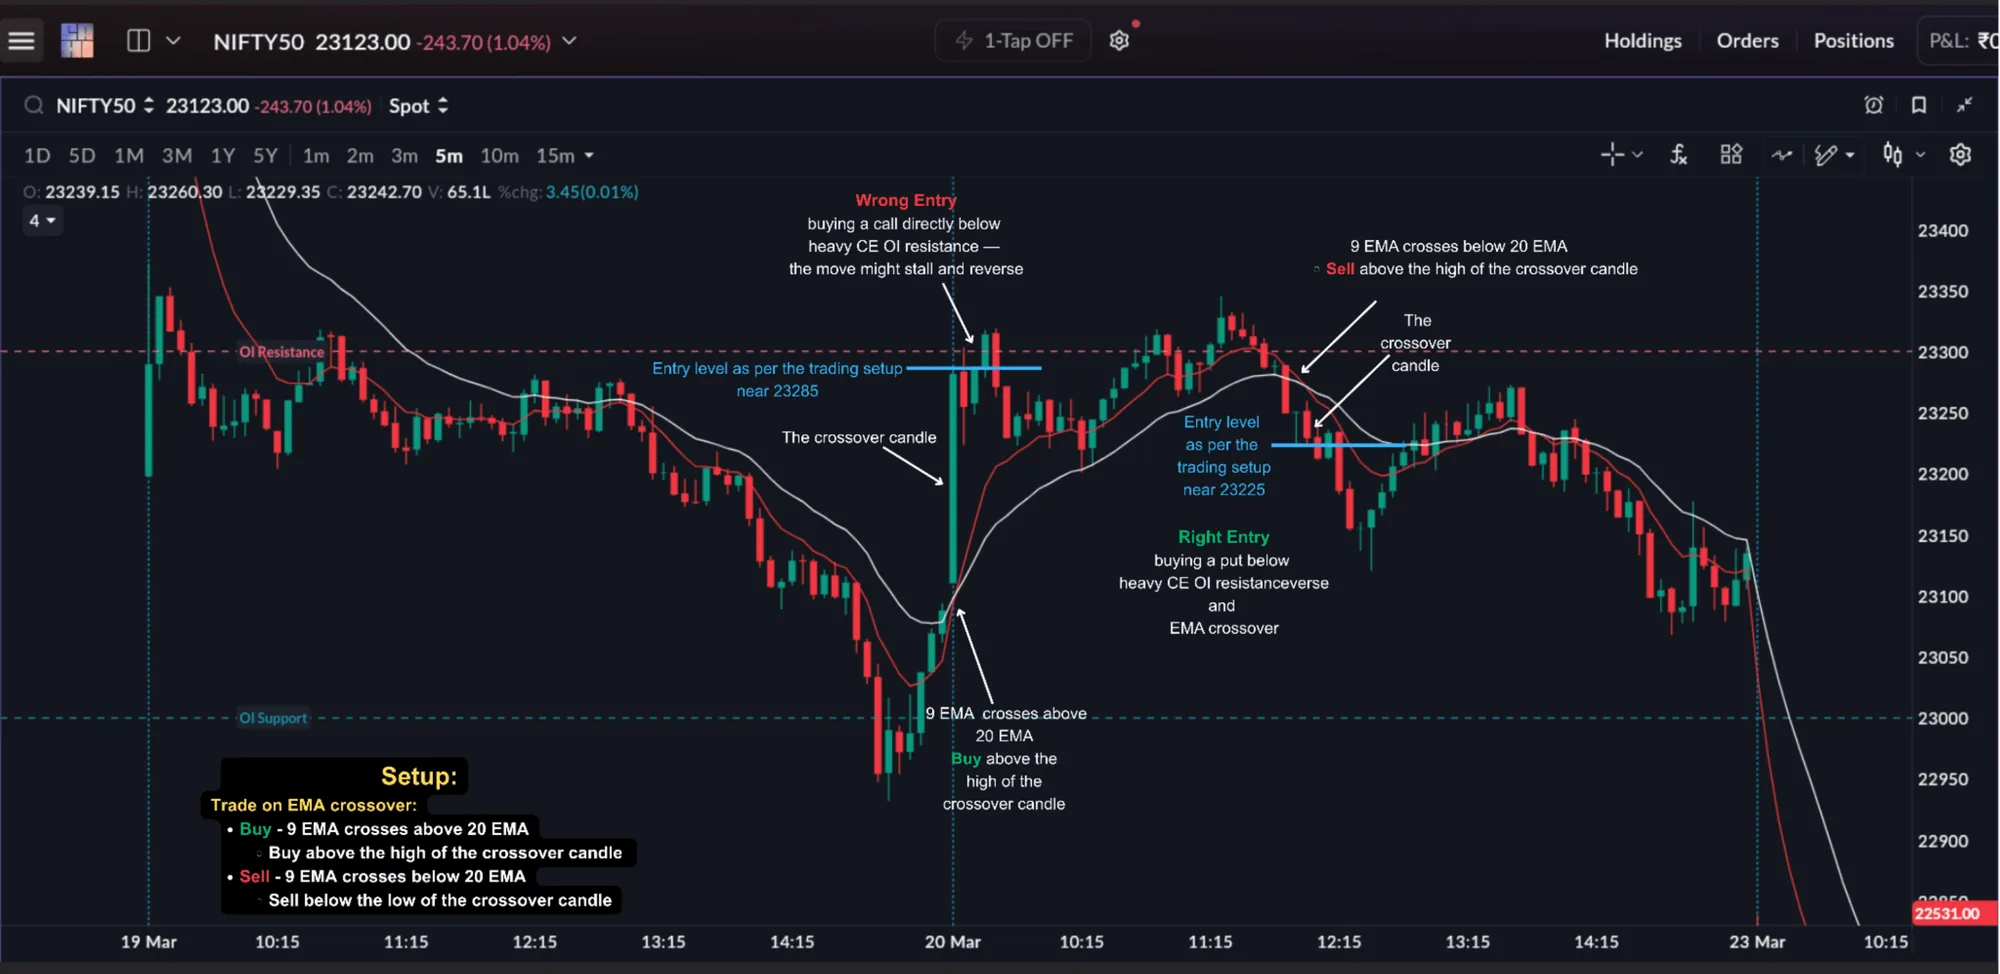
What happened. You bought a call on a valid chart setup, a few points below the strike with the heaviest Call OI.
Why it failed. Sellers were positioned at that level. The move stalled and reversed, so the trade's reward was squeezed from the start.
The fix. Check OI before entry, not after the trade fails. If a strong wall sits just above (or below) your entry, skip the trade or wait for price to break and hold beyond it.
Scenario 4: Ignoring volatility conditions
Not every session supports momentum scalping. A setup may trigger and the index may move your way, yet the option premium responds less than you expected. Volatility often explains the difference.
- Low-volatility sessions: breakouts struggle to continue, ranges are common and follow-through is limited. A technically correct breakout may simply lack the energy to run.
- Around major events: implied volatility (IV) may rise sharply before the event and fall sharply after it. Your direction can be right while the premium still disappoints.
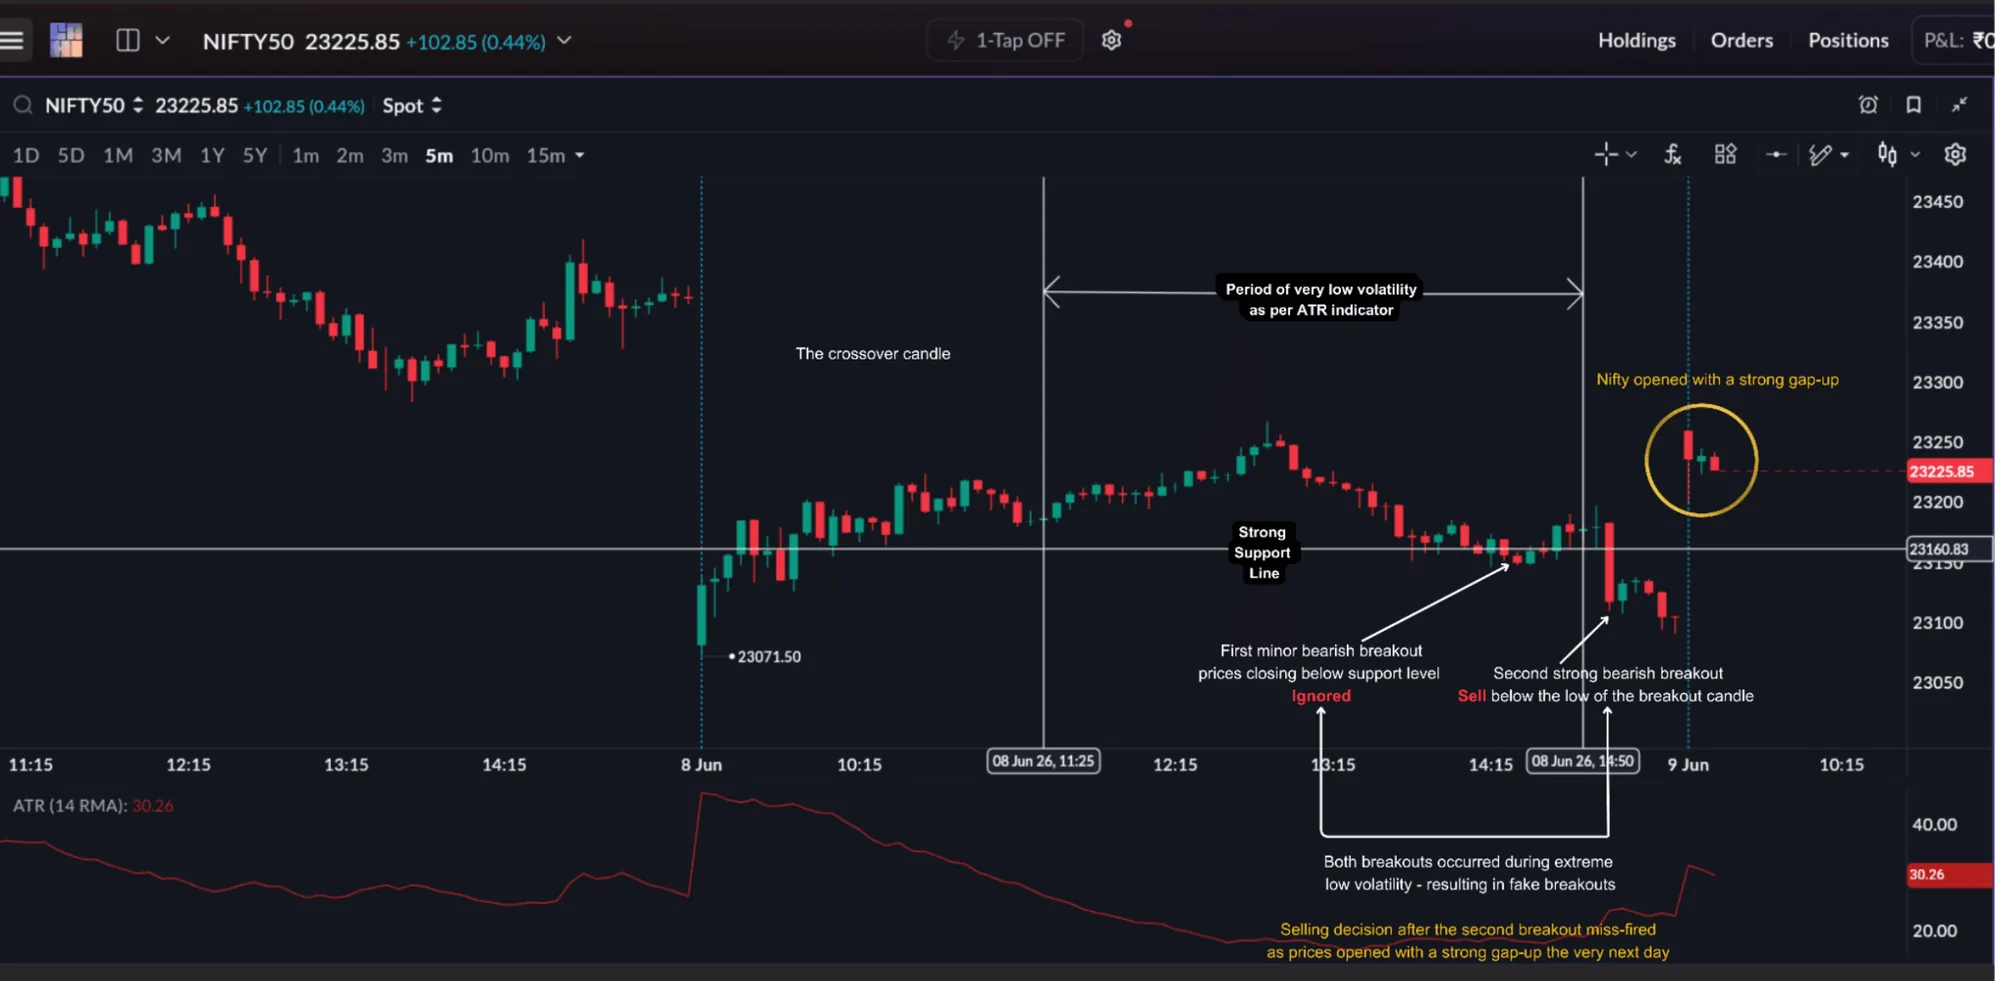
What happened. You sold a breakdown below support in a session where ATR had been very low for many candles.
Why it failed. There was no energy behind the move, so there was no follow-through and the premium barely expanded.
The fix. Check ATR and the Bollinger Band width before entry. In a quiet session, trade less, expect smaller targets, and be wary of buying options just before a major event.
Contract mistakes: poor strike selection
Scenario 5: The cheap far OTM option
Direction, price action, OI and volatility can all be right, and the trade can still underperform because you picked the wrong contract. Many new traders choose a strike because its premium is low. Cheap premiums are cheap for a reason. Far out-of-the-money (OTM) options have no intrinsic value and usually have:
- a low Delta, so the premium moves only a little for each point the index moves;
- slow response to price movement;
- a need for a very strong move to pay off;
- high sensitivity to time decay.
For illustration: you expect Nifty to rise and buy a far OTM call for ₹12. Over the next hour Nifty rallies 80 to 100 points.
| Contract | Premium at entry | After the rally | Result |
|---|---|---|---|
| Far OTM call | ₹12 | ₹14 | Barely reacts despite the rally |
| ATM call | ₹100 | ₹125 | Responds clearly to the same move |
Sample numbers for illustration. Actual premiums depend on the strike, days to expiry and implied volatility.
At-the-money (ATM) options are generally preferred for scalping. With a Delta near 0.5, the premium reacts meaningfully to index moves without needing a very large move.
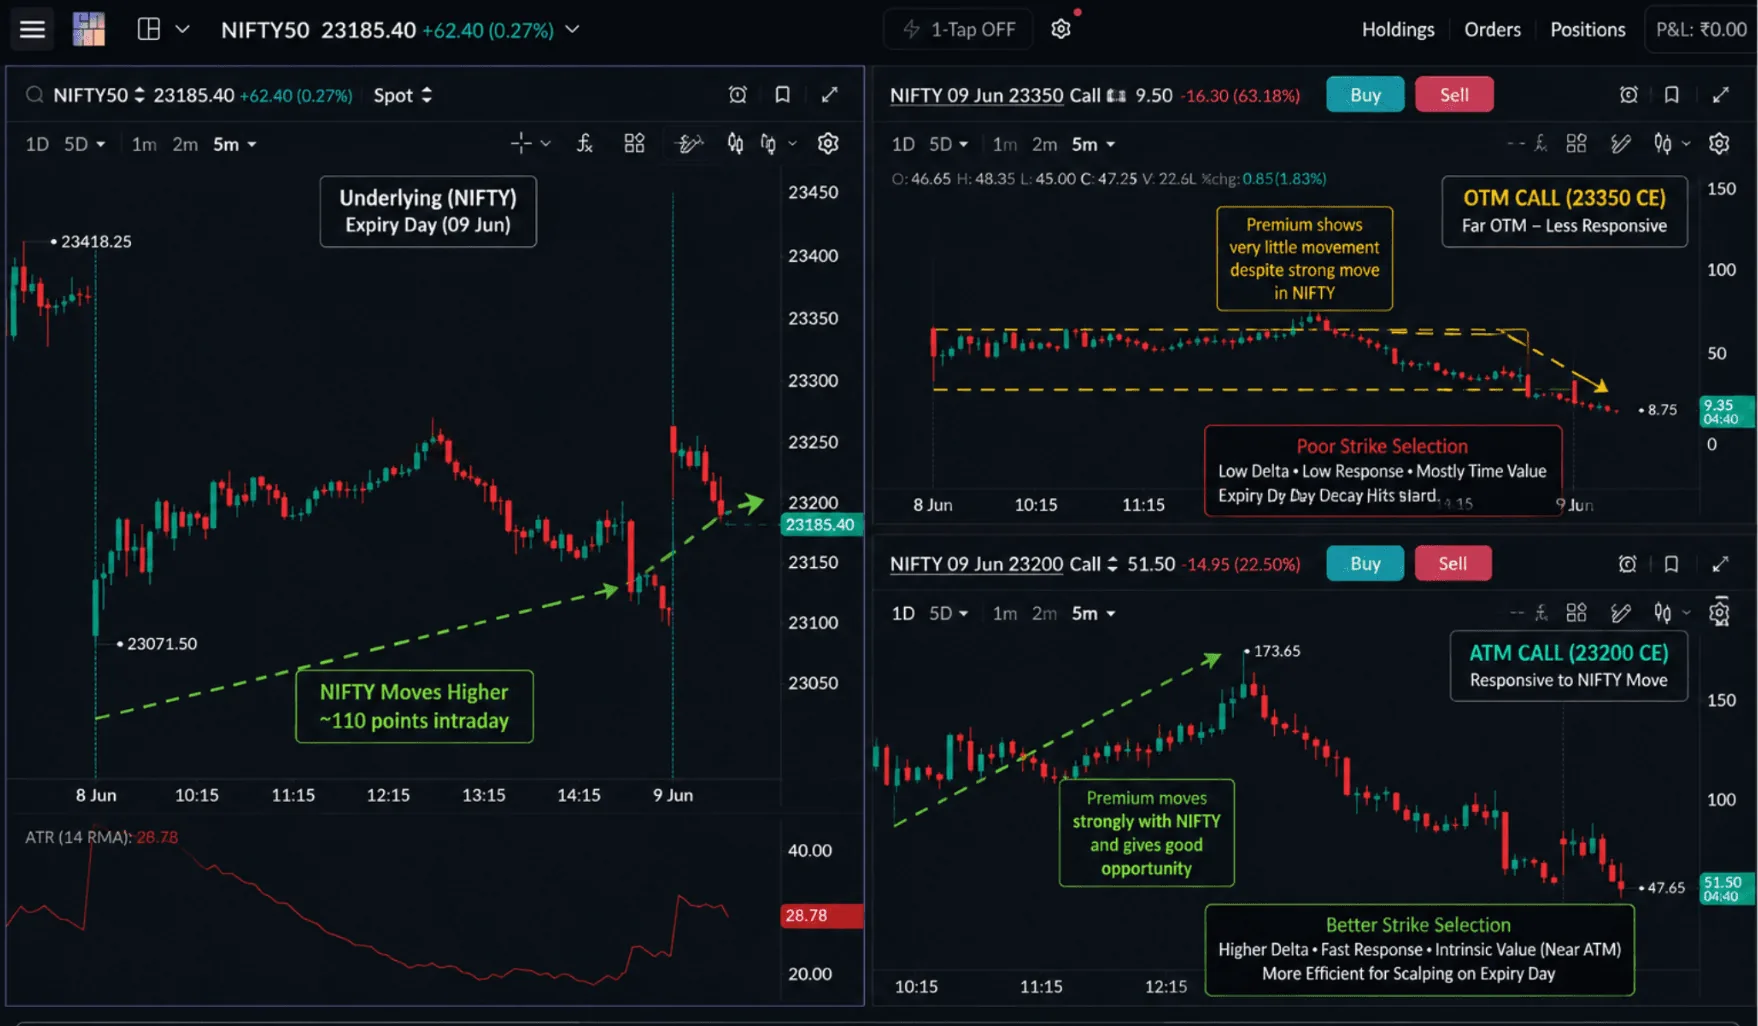
What happened. Your direction was right and Nifty moved, but your far OTM option hardly gained.
Why it failed. Low Delta and heavy time decay meant the premium could not respond to the move.
The fix. Scalp ATM or near-ATM strikes that react to the index. Choose the contract for its response, not for its price.
Exit mistakes: holding too long
Scenario 6: Waiting for more after momentum stops
Scalping is built to capture momentum. When momentum slows, the trade changes character, and this is where many traders give back their profit. The trade works early, you wait for more, price stalls, and the premium slowly leaks away:
- premium falls gradually through time decay (Theta);
- the chance of a reversal rises as price stalls;
- the open gain fades and the trade drifts to break-even or a loss.
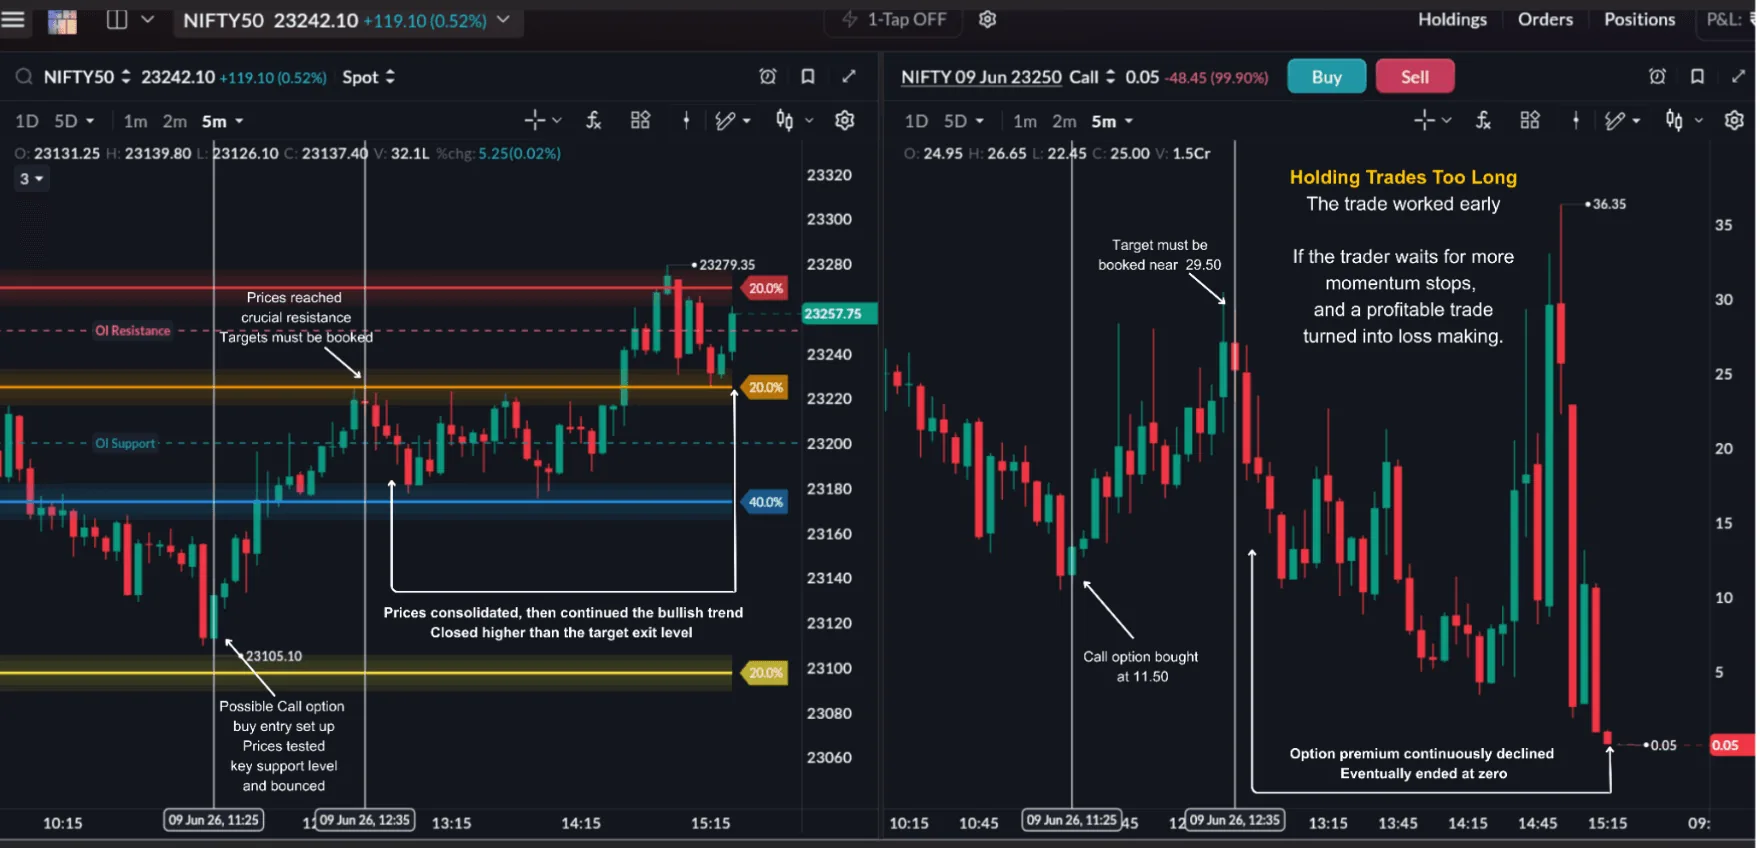
What happened. The trade reached resistance with a good profit. You held for a bigger target while the candles shrank.
Why it failed. The momentum that justified the trade had ended. Time decay and the stall took back the gain.
The fix. Exit on momentum, not on the target alone. If the premium stops expanding and price stalls at a level, that is information. Book the profit or trail the stop tightly.
Behaviour mistakes: revenge, indicators, bias
Scenario 7: Revenge trading after a loss
Losses are part of trading. The damage usually comes from what you do next. The urge to win the loss back quickly leads to more trades, lower-quality entries, setups that do not meet your filters, ignored time-of-day rules, larger size to "make it back", and less patience. This is revenge trading. It rarely recovers the loss and usually adds to it, because the new trades come from your emotional state, not from analysis.
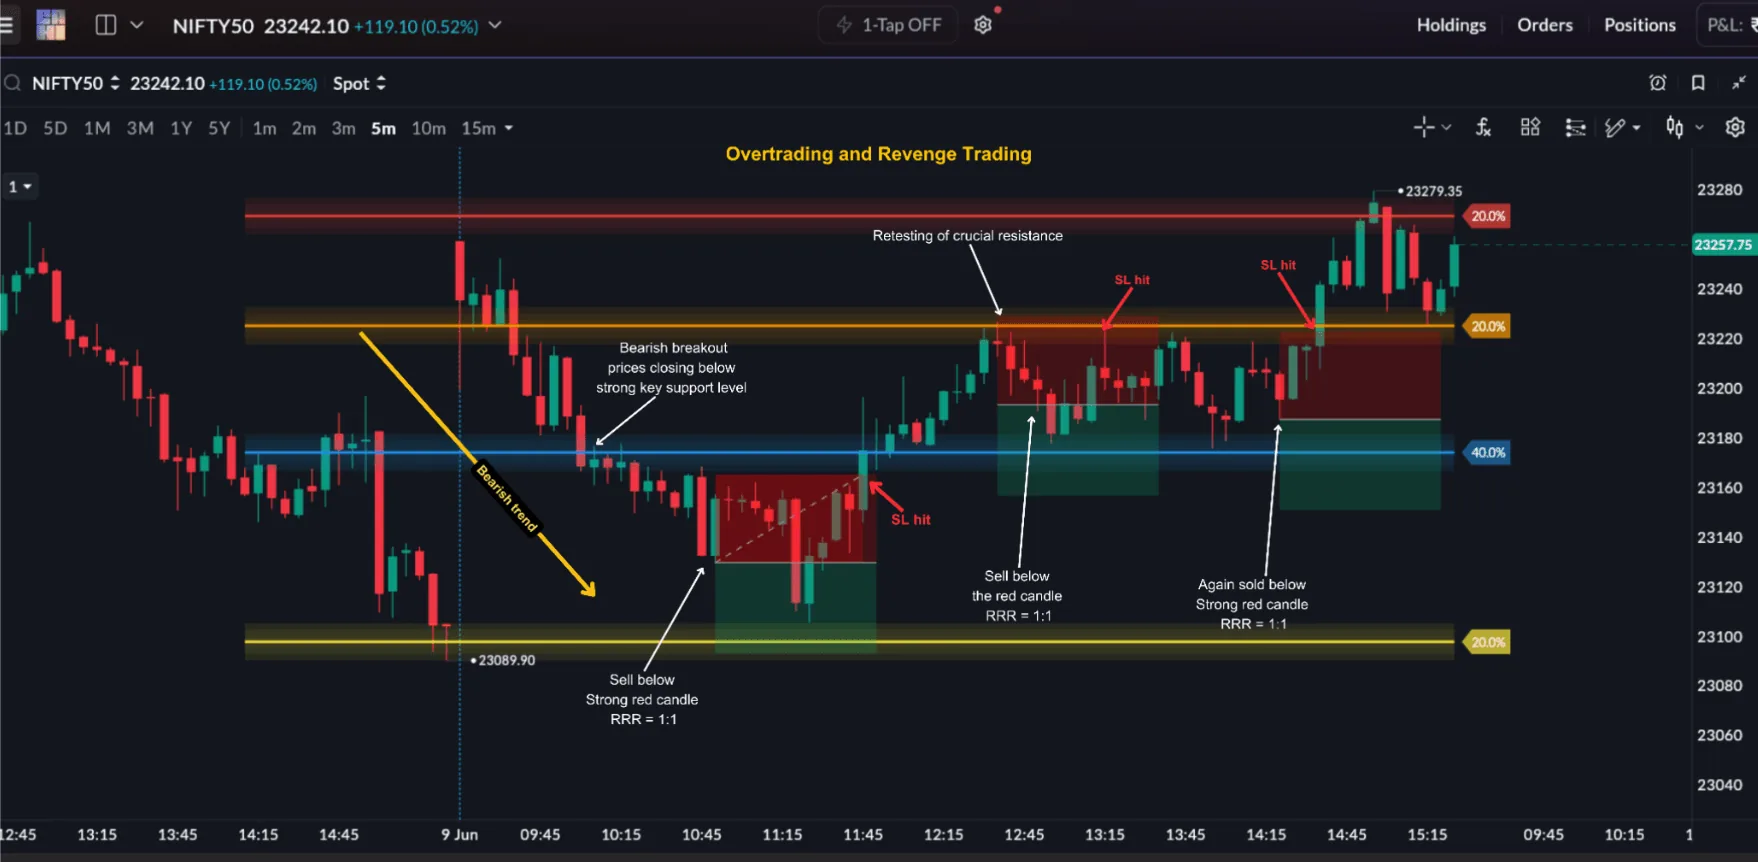
What happened. After one stop-loss you took three quick trades in the same direction to recover it.
Why it failed. The new trades did not meet your setup rules. The first loss was limited; the response to it was not.
The fix. Set a daily rule in advance, such as a maximum number of losing trades, and step away from the screen when you reach it. One losing trade is normal; process matters more than quick recovery.
Scenario 8: Indicator signals without context
As the previous chapter showed, indicators organise information; they are not signals on their own. Used without a price level and market context, they produce trades that look valid in isolation and fail in practice: buying only because RSI is oversold, selling only because it is overbought, or trading EMA crossovers inside a sideways market.
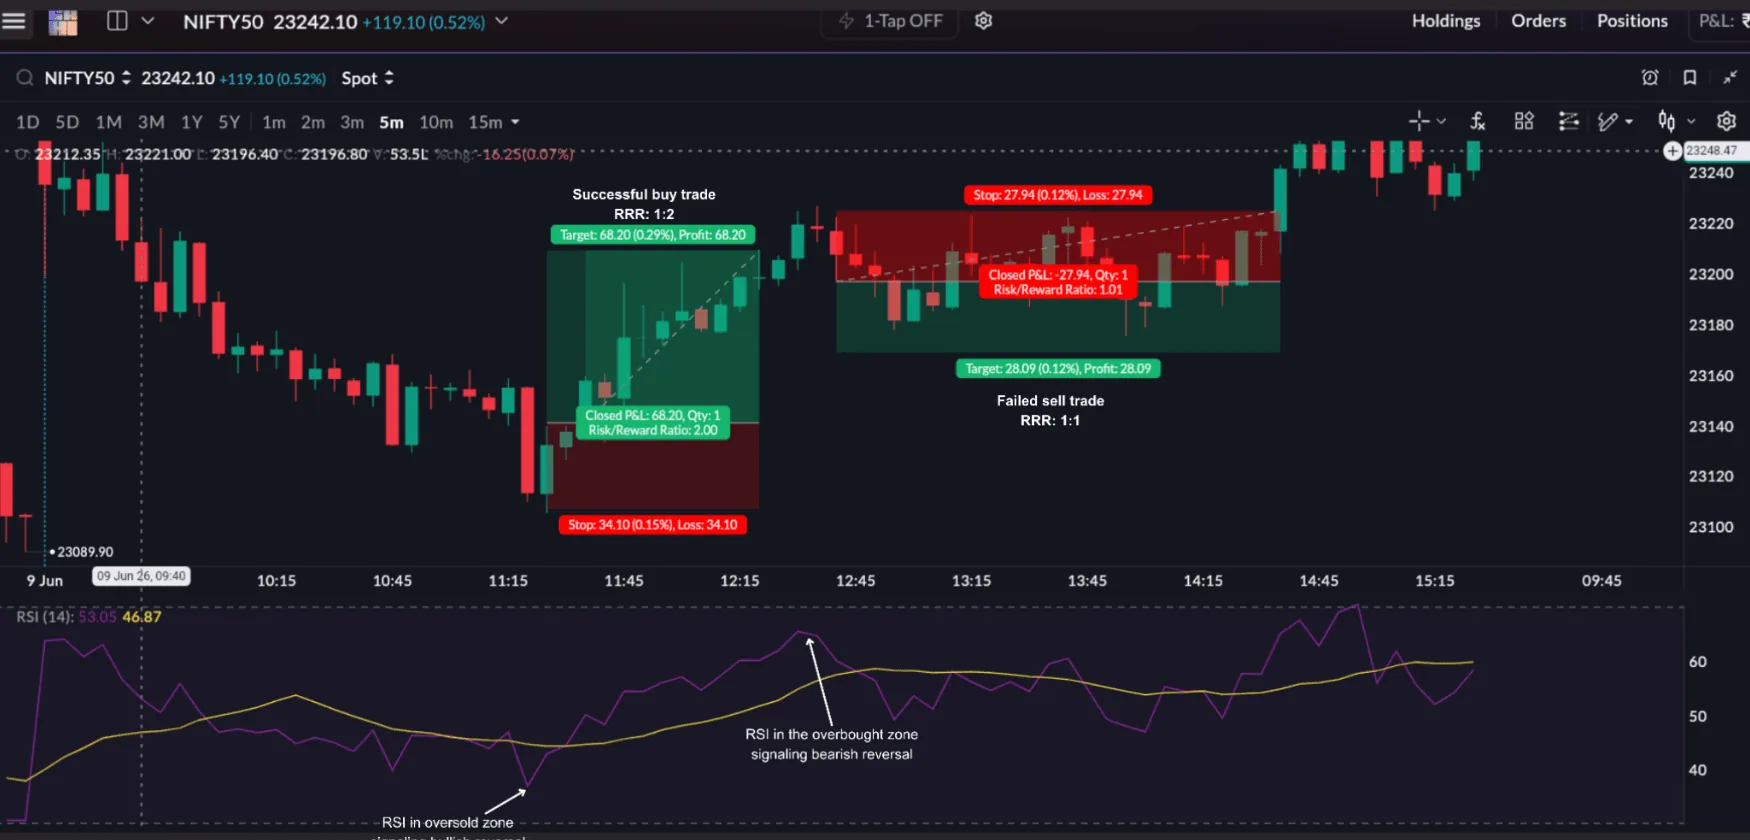
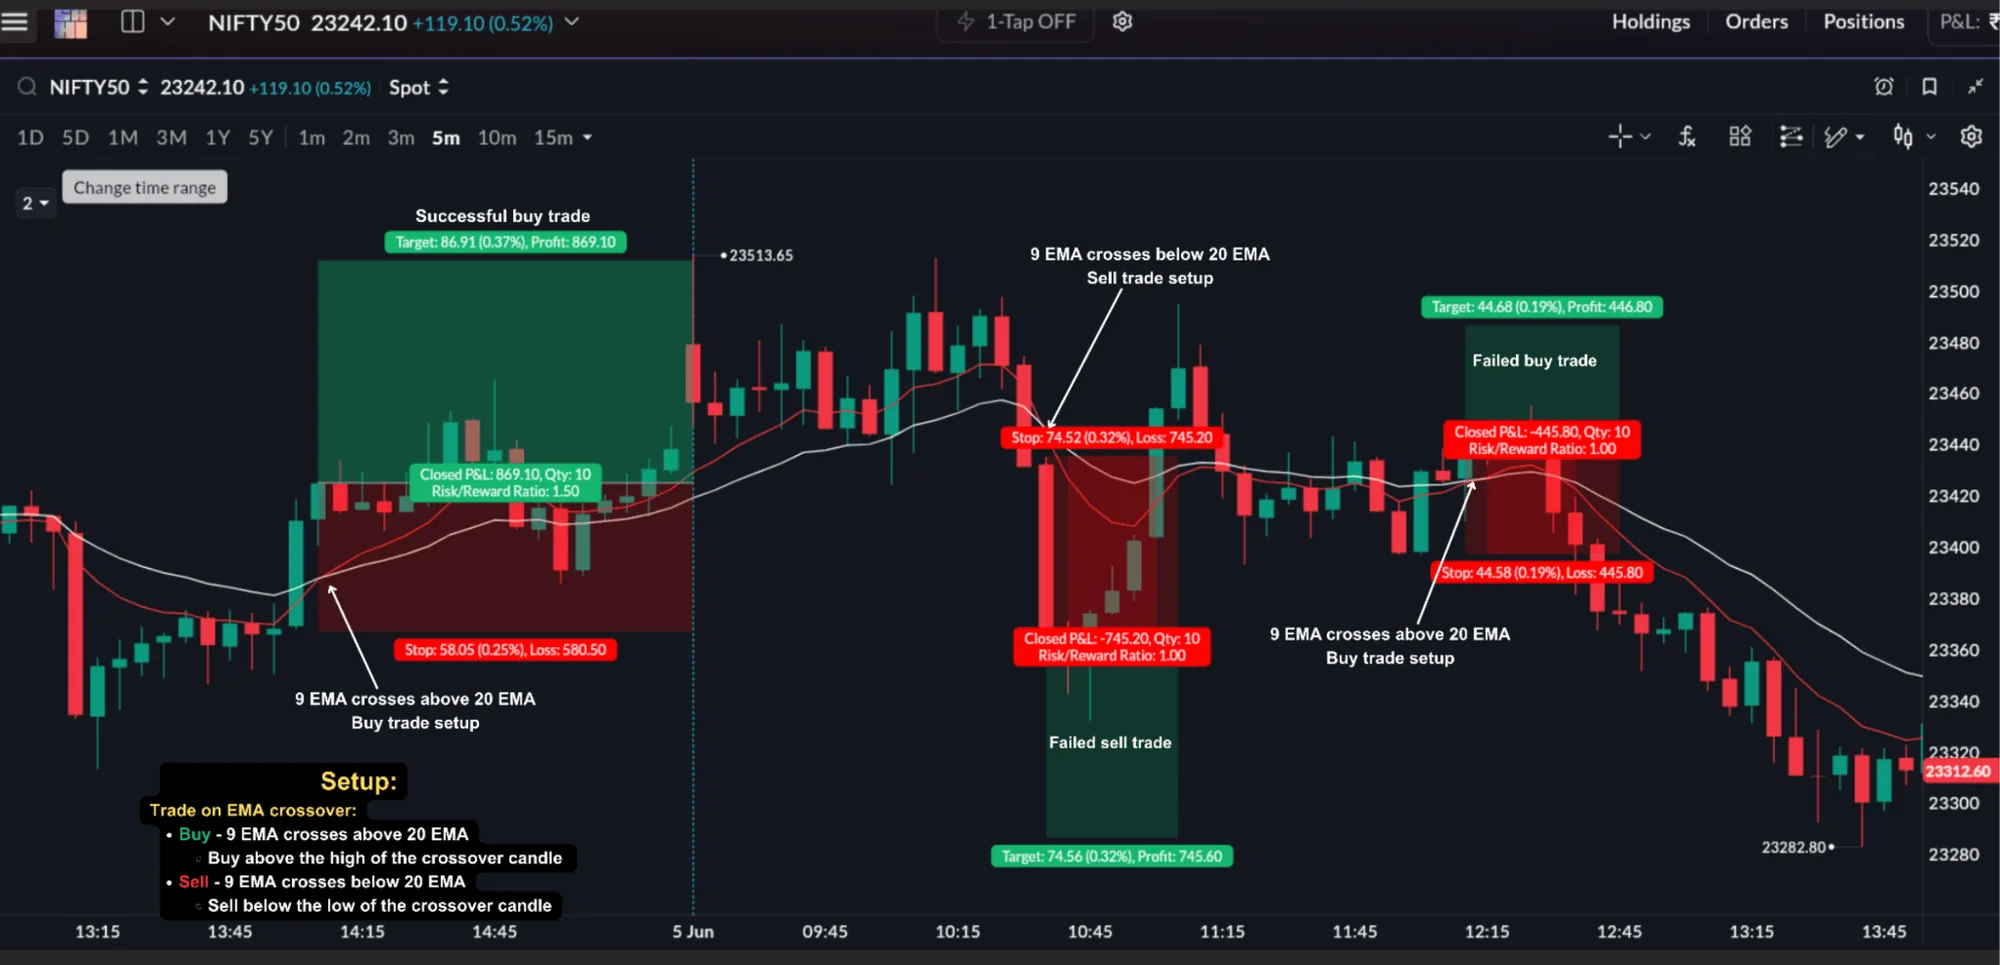
What happened. You sold because RSI was overbought, or bought a crossover in a flat market.
Why it failed. There was no level, no structure and no context behind the signal.
The fix. Context creates the opportunity; indicators only help to validate it. Start from a level and a candle, then check the indicator.
Scenario 9: False confirmation and the moved stop
Confirmation bias is the habit of seeing what supports the trade you already want and ignoring what contradicts it. It shows up as seeing confirmation in a partial signal, holding a bullish or bearish view after the structure has changed, refusing the invalidation because "the view is still correct", and moving the stop-loss away because the trade is under pressure.
The stop was placed where the setup stops being valid. If you move it under pressure, you are no longer trading the original setup; you are reacting emotionally. Moving a stop-loss is often the clearest sign that the risk plan has been abandoned.
What happened. Price hit your invalidation level, and you moved the stop further away because you still believed in the trade.
Why it failed. A small, planned loss became a large, unplanned one.
The fix. Define invalidation in price and in time before entry: if the trade does not work within a set number of candles or breaks the level, exit. Confirmation must come from the market, not from your expectation.
What good execution looks like
Put the nine scenarios side by side and good execution becomes clear. A high-quality scalp has:
- Context alignment: OI, structure, volatility and session conditions support the trade.
- A clean entry: at the right stage of the setup, not after the move has expanded.
- Controlled risk: a stop at the structural level, set before entry and not moved.
- A disciplined exit: based on momentum and premium behaviour, not on hope.
- Quick acceptance of invalidation: if the trade does not behave as expected, close it without hesitation.
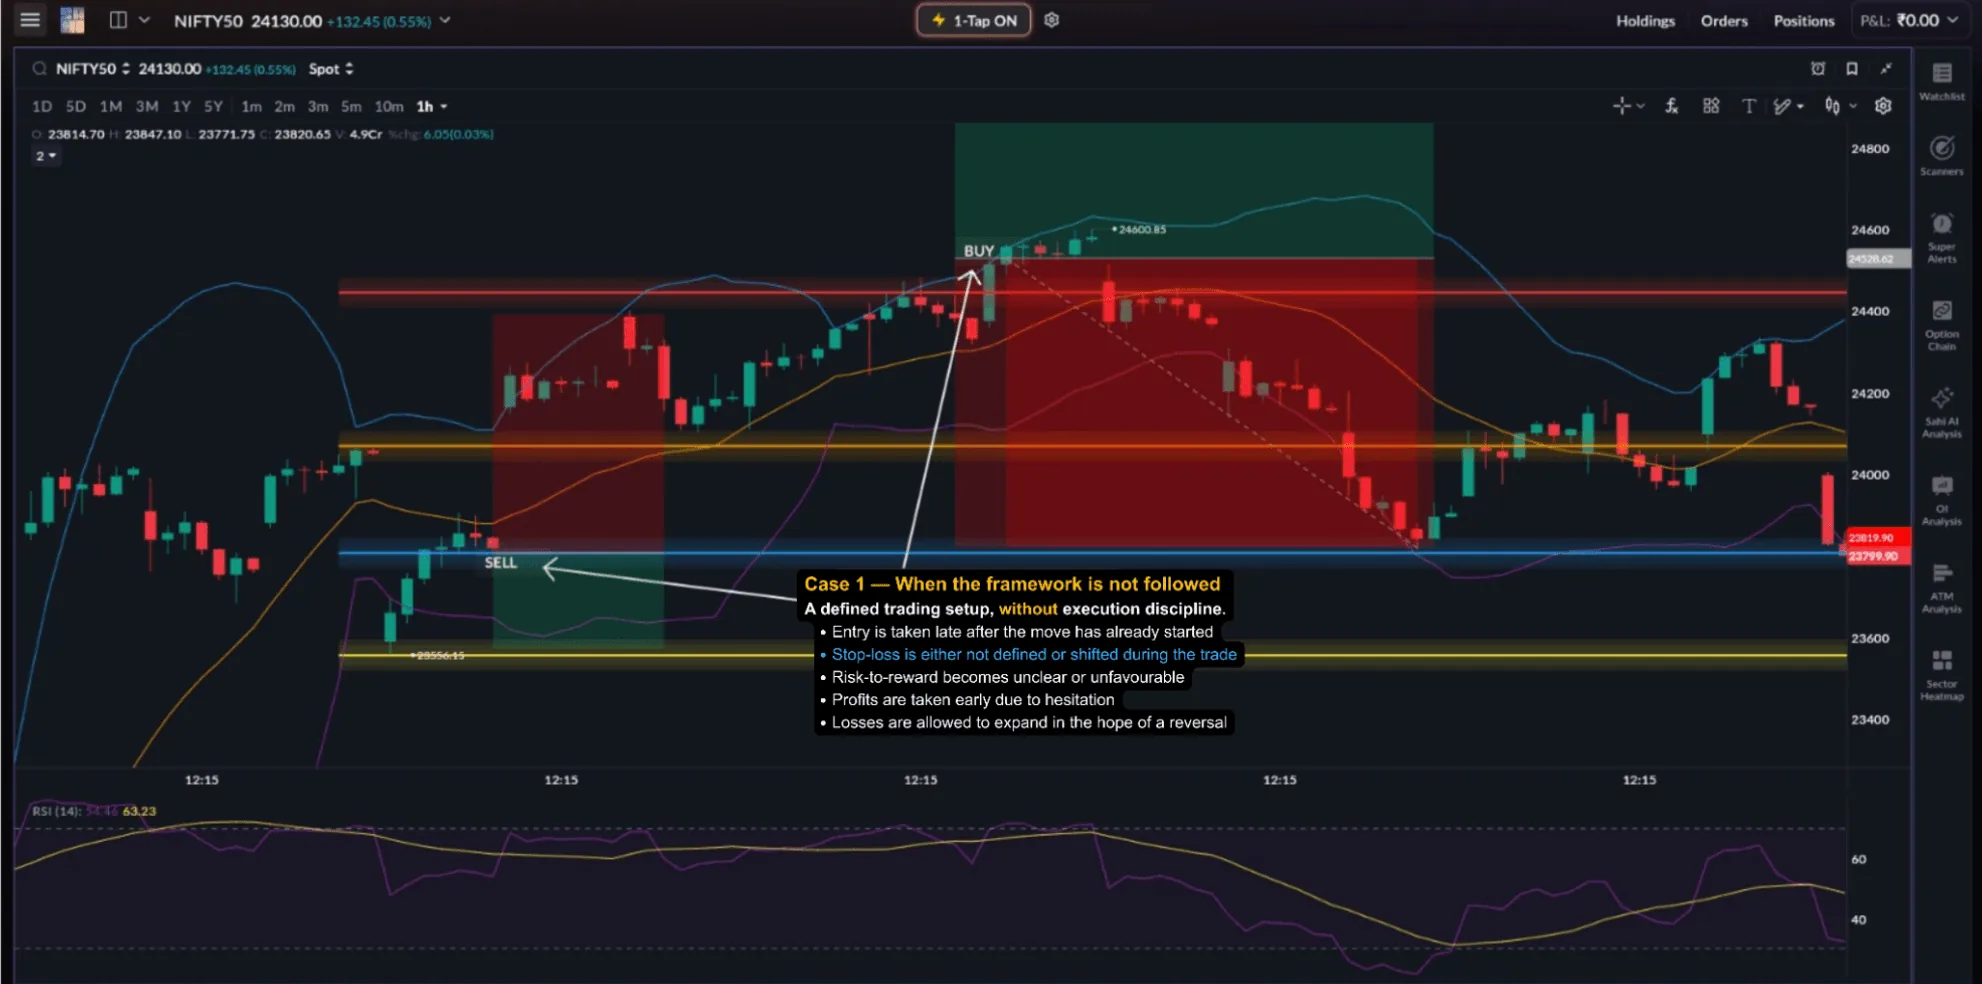
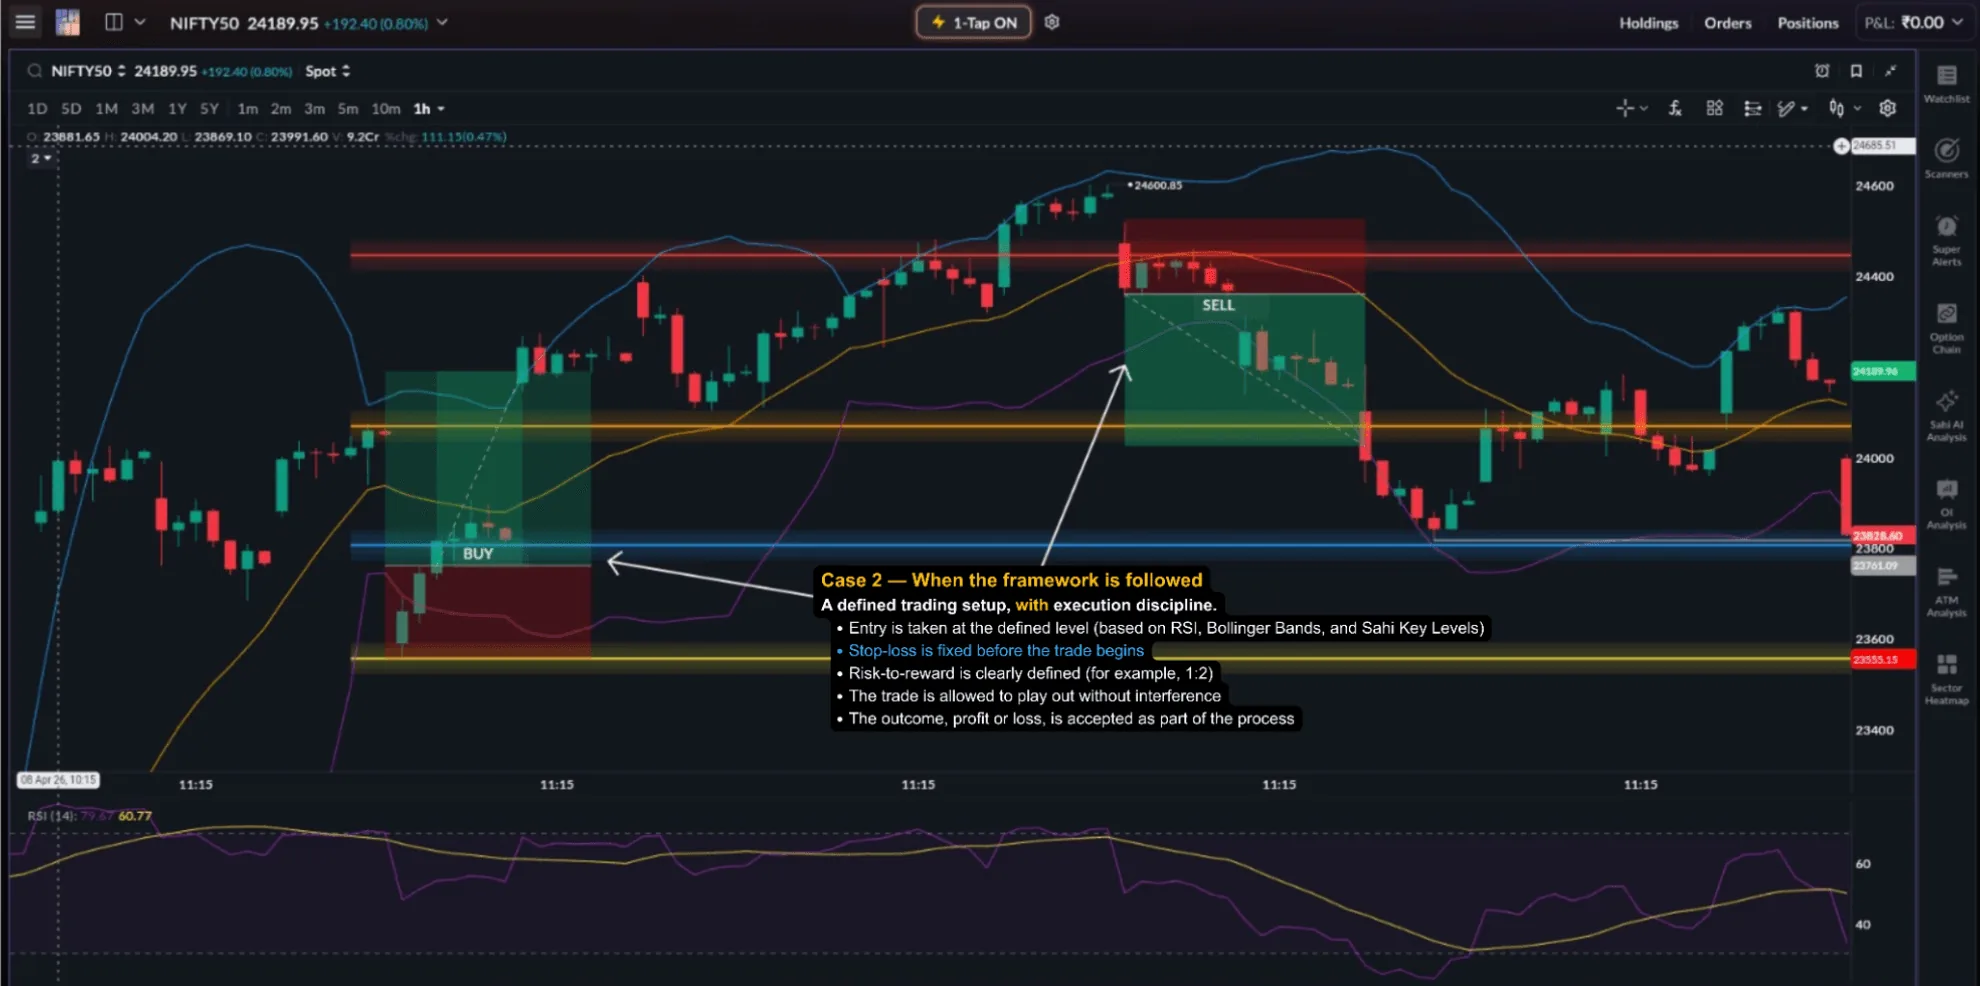
All nine at a glance
| Mistake | Warning sign before entry | Fix |
|---|---|---|
| 1. Late chase | Price far from the level and from VWAP | Enter near the level or on the retest |
| 2. Breakout trap | Breakout candle on thin volume | Wait for volume and a hold; exit if back inside |
| 3. OI wall | Heavy CE (or PE) OI just ahead of entry | Skip, or wait for a break beyond the wall |
| 4. Quiet market | Low ATR, narrow bands; event ahead | Trade less; smaller targets |
| 5. Cheap strike | Far OTM chosen for its low price | ATM or near-ATM strikes |
| 6. Overstaying | Candles shrinking at a level, premium flat | Exit on momentum; trail the stop |
| 7. Revenge trading | Urge to recover a loss now | Daily loss rule; step away |
| 8. Lone indicator | Signal with no level behind it | Level and candle first |
| 9. Moved stop | Stop and time limit not written down | Fix invalidation before entry |
Not every trade will be profitable, and that is not the aim. The aim is to keep taking trades where probability, execution and risk line up. Consistency comes from execution quality, not from individual wins.
Avoiding mistakes is one side of scalping. The other is choosing better trades in the first place. The next chapter shows how to read the Option Chain and Open Interest during a live session to find positioning, likely support and resistance zones and better strikes.
Checklist
- Enter near the level or on the retest; never chase a move far from the level and VWAP.
- Trust a breakout only when it closes beyond the level on clearly higher volume and holds.
- Check OI walls, ATR and events before entry, not after the trade fails.
- Scalp ATM or near-ATM strikes; a cheap premium is not a cheap trade.
- Exit when momentum stops; set the stop and time limit before entry and never move it away.
- After a loss, review before the next trade. One loss is normal; revenge trading is not.
Questions
Why do good-looking setups sometimes fail?
Because the setup is only one part of the trade. Context, positioning, volatility, strike selection and execution all affect the outcome.
Is a losing trade always a mistake?
No. A well-executed trade can still lose. Judge the trade by whether you followed your process, not only by the result.
Why do late entries perform poorly?
A late entry comes after much of the move and the premium expansion has already happened. The stop has to be larger, the remaining reward is smaller, and a normal pullback can stop you out.
Should I avoid indicators?
No. Indicators are useful confirmation tools. Problems start when they are used without a price level, structure and context.
What is the most common behavioural mistake in scalping?
Overtrading after losses. Many traders damage their results not through the first loss, but through the decisions that follow it.
Chapter 8 check
Test yourself: why scalp trades fail
Five quick questions on the execution mistakes that cause scalp trades to fail. Under 3 minutes
-
Show answer
Answer: D. Because several factors, such as execution, context and risk structure, work against the trader at the same time. The setup is only one part of the outcome. Trades usually fail when poor execution, weak context, chasing and an ignored risk structure combine, and most of these are within your control.
-
Show answer
Answer: B. The stop-loss becomes larger, the reward smaller, and the entry is at an inflated premium. A late entry turns a breakout trade into a chase: risk-reward worsens, the premium is already inflated, and a pullback becomes more likely.
-
Show answer
Answer: A. The move may stall or reverse because the OI zone acts as resistance. Heavy CE OI often acts as resistance because it reflects real positions. Price is often absorbed or reversed near such zones, which squeezes the trade's reward from the start.
-
Show answer
Answer: C. Far OTM contracts have low Delta, respond slowly and are more sensitive to time decay. Far OTM options have no intrinsic value and a low Delta, so even a correct view can produce little premium movement. ATM strikes, with a Delta near 0.5, respond far better.
-
Show answer
Answer: B. Revenge trading: forcing quick trades to recover the loss. Revenge trading rarely recovers losses and usually adds to them, because the new trades come from emotion rather than analysis. The first loss was limited; the response often is not.
You got 0 of 5 right.