

Most scalpers start with the chart, and that is the right place to start. But a chart only shows how price is moving. It does not show who is holding positions at each strike, or where those positions are being built and unwound. The option chain fills that gap. Used with price action, it gives you a fuller picture before you place a scalp.
What the option chain adds to your chart
The option chain is a live table of every strike for one expiry: calls on the left, puts on the right, and the strike price in the middle. It shows where traders are most active, where positions are being built and where they are being closed.
The chain has many columns. For intraday scalping, three of them do most of the work:
| Column | What it counts | What it tells a scalper |
|---|---|---|
| Open Interest (OI) | Contracts still open at that strike | Where large positions sit; these strikes often act as support or resistance |
| Change in OI | How much OI has been added (+) or closed (−) since the previous session | Where traders are building or leaving positions today |
| Volume | Contracts traded today at that strike | Where the activity and liquidity are right now |
OI is a stock of open positions; volume is a flow of trades. A strike can show heavy volume with little change in OI when traders open and close within the day. Read the two together.
The option chain does not replace price action. It is a second layer that tells you whether positioning supports what the candles are already showing.
You can open the same view on our live option chain and follow along with this chapter.
Read a sample chain in one minute
Here is a small part of a Nifty chain, made up for illustration. Nifty spot is near 24,020 at about 09:30, so the at-the-money (ATM) strike, the one closest to spot, is 24,000. All figures are in lakh.
| Call OI | Call Chg OI | Call vol | Strike | Put vol | Put Chg OI | Put OI |
|---|---|---|---|---|---|---|
| 14 | −2 | 60 | 23,850 | 240 | +18 | 72 |
| 21 | −4 | 110 | 23,900 | 410 | +34 | 128 |
| 26 | +2 | 230 | 23,950 | 380 | +22 | 81 |
| 68 | +15 | 640 | 24,000 ATM | 590 | +24 | 96 |
| 74 | +22 | 520 | 24,050 | 260 | +6 | 41 |
| 132 | +38 | 470 | 24,100 | 140 | +1 | 24 |
| 61 | +11 | 210 | 24,150 | 60 | −1 | 12 |
| 58 | +9 | 150 | 24,200 | 30 | 0 | 9 |
Read it in four steps:
- Find the ATM strike. 24,000. This is where most scalping happens, because it is the most liquid and the most responsive to Nifty's moves.
- Find the walls. The highest Call OI is at 24,100 (132 lakh): a likely resistance zone. The highest Put OI is at 23,900 (128 lakh): a likely support zone. For now, the market sits inside a 23,900 to 24,100 box.
- Read the change. Call writers are adding above price (+38 lakh at 24,100, +22 lakh at 24,050). Put writers are adding below price (+34 lakh at 23,900). Both sides are building, so neither is in control yet.
- Read the volume. The heaviest volume is at 24,000 on both sides. That is where the action is, and where a scalper's strike will usually come from.
One minute of reading gives you a working map: a range between two walls, a balanced bias, and the strike to trade. The rest of this chapter explains each step in more detail.
Set the day's bias at the Reference Strike
Before you look for setups, form a working bias for the session. One practical way is to watch how OI changes around the market's opening price.
As discussed in earlier chapters, the first few minutes of the session are for observation, not execution. Use that time to see how option writers position themselves around the open. We call the strike closest to the opening price the Reference Strike.
| Call OI change | Put OI change | What it means | Bias |
|---|---|---|---|
| Increasing | Decreasing | Call writing rising, put support weakening | Bearish |
| Decreasing | Increasing | Put writing rising, call resistance weakening | Bullish |
| Increasing | Increasing | Both sides building positions | Range-bound / neutral |
| Decreasing | Decreasing | Positions unwinding on both sides | Uncertain |
The aim is not to predict an exact price. It is to see which side of the market is attracting stronger participation. In the sample chain above, the Reference Strike is 24,000 and both sides are adding (Calls +15 lakh, Puts +24 lakh), so the starting bias is range-bound.
A real example: NIFTY on 12 June 2026
NIFTY opened near 23,412, so 23,400 became the Reference Strike.
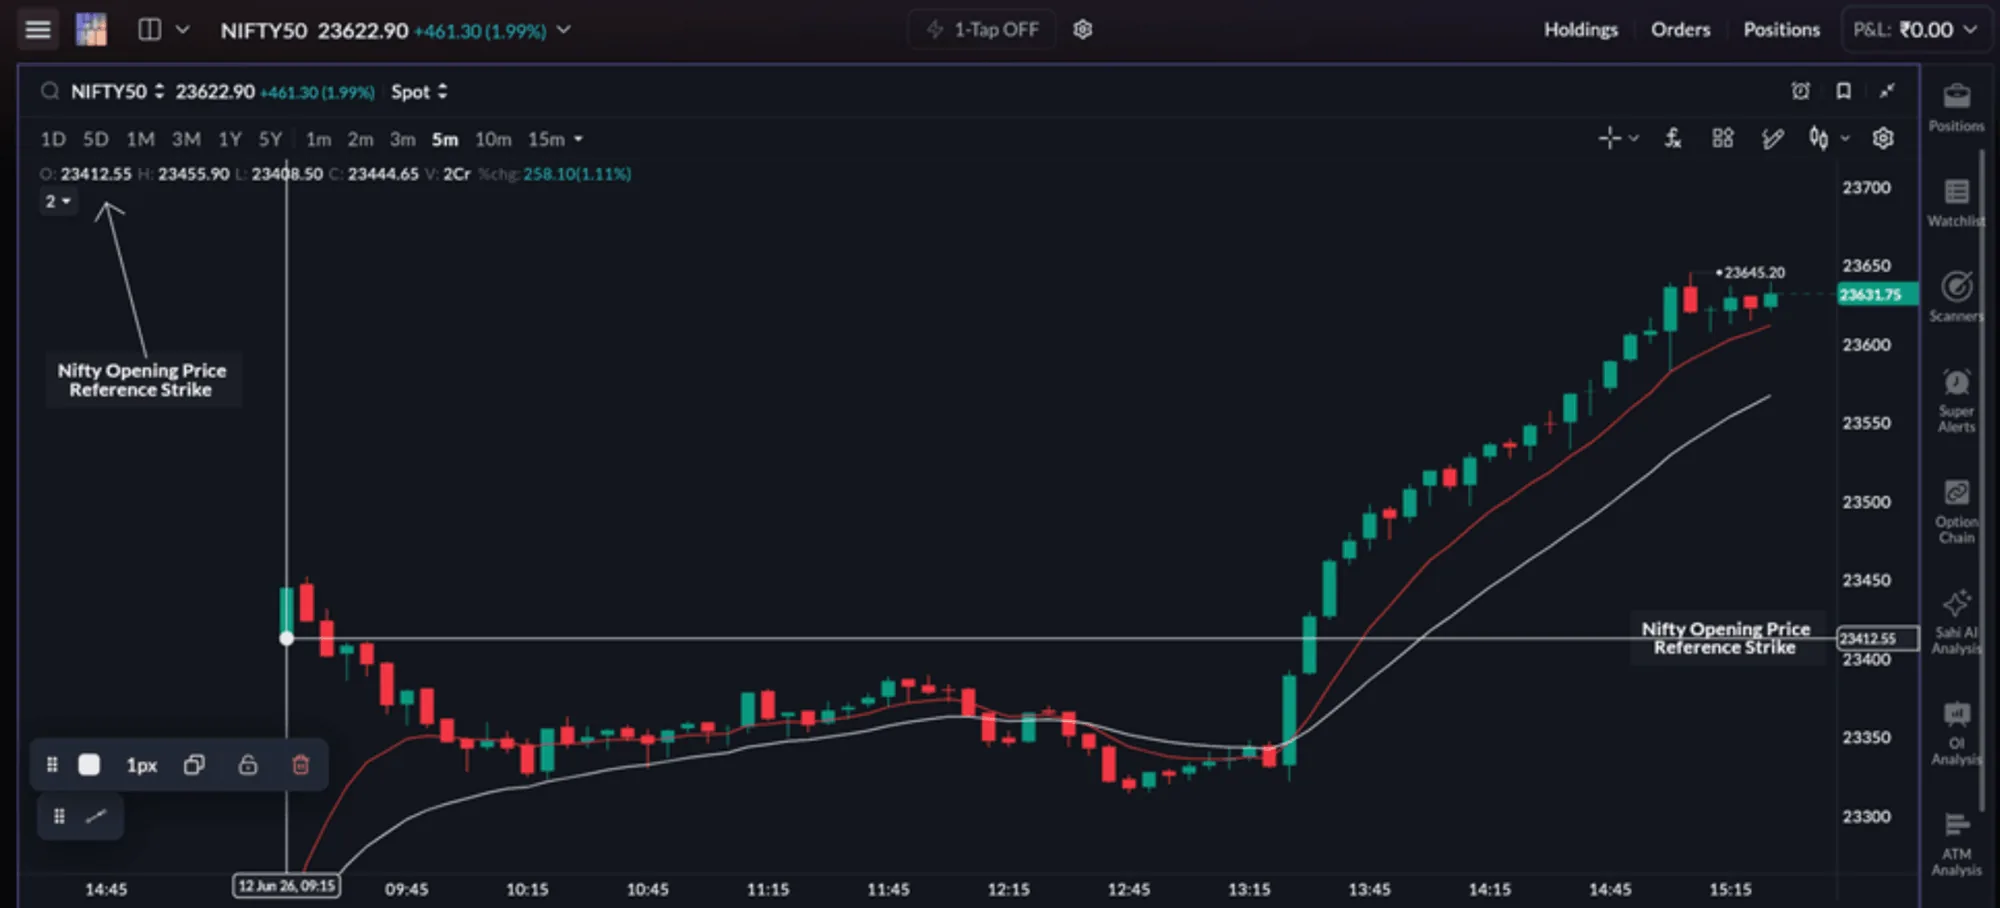
The option chain then showed this at the 23,400 strike:
| At the Reference Strike (23,400) | Value |
|---|---|
| Change in Call OI | −19.01 lakh |
| Change in Put OI | +76.35 lakh |
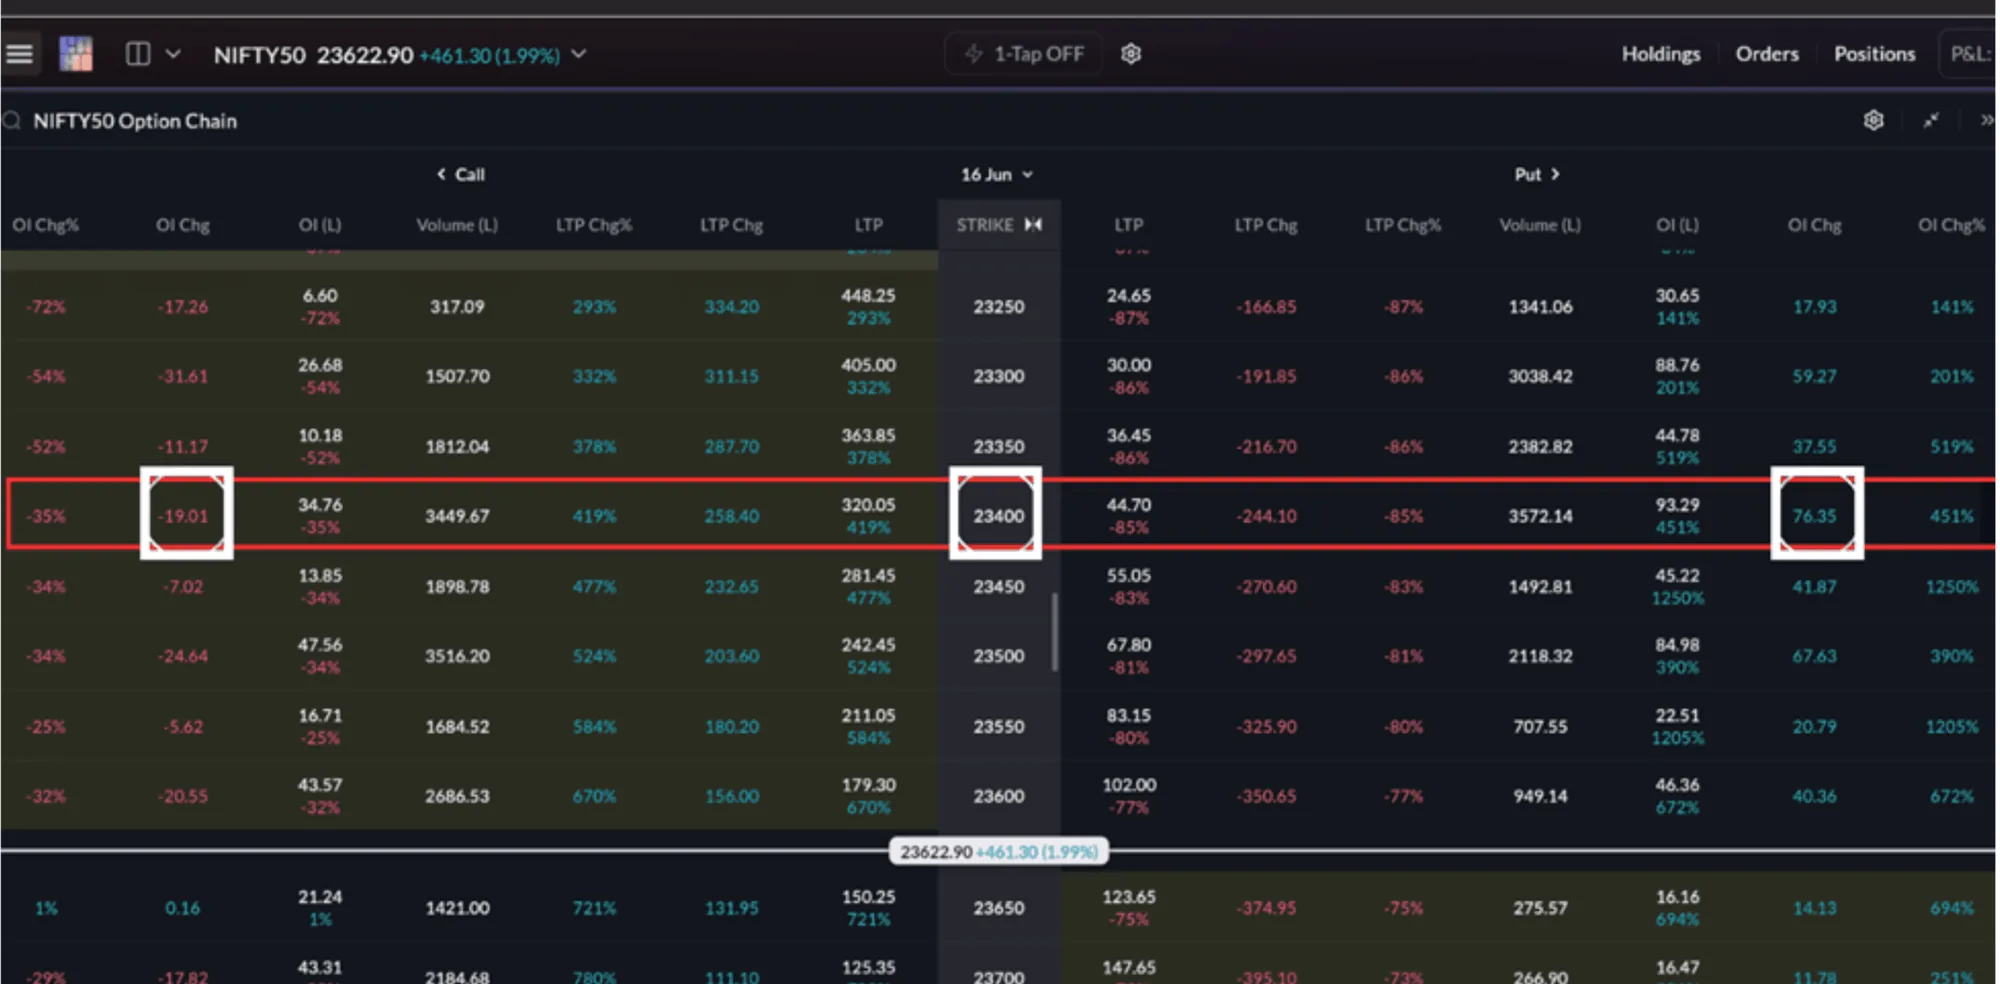
Put writing was aggressive at 23,400 and call writers were cutting positions. Support was strengthening below price and resistance was weakening above it, which points to a bullish intraday bias. Participants were more comfortable defending lower levels than resisting higher ones.
A bias is not an entry. On this day, price spent much of the session close to or below the Reference Strike before it moved above it in the afternoon and trended higher. The bias told you which side to favour; price action told you when.
OI walls as support and resistance
The most practical use of the chain is to find likely support and resistance zones. Large concentrations of OI, often called OI walls, tend to create them:
- The strike with the highest Put OI often acts as a support zone.
- The strike with the highest Call OI often acts as a resistance zone.
This happens because traders holding large positions tend to defend these areas. As price approaches them, reactions become more visible: wicks, slower candles, smaller bodies.
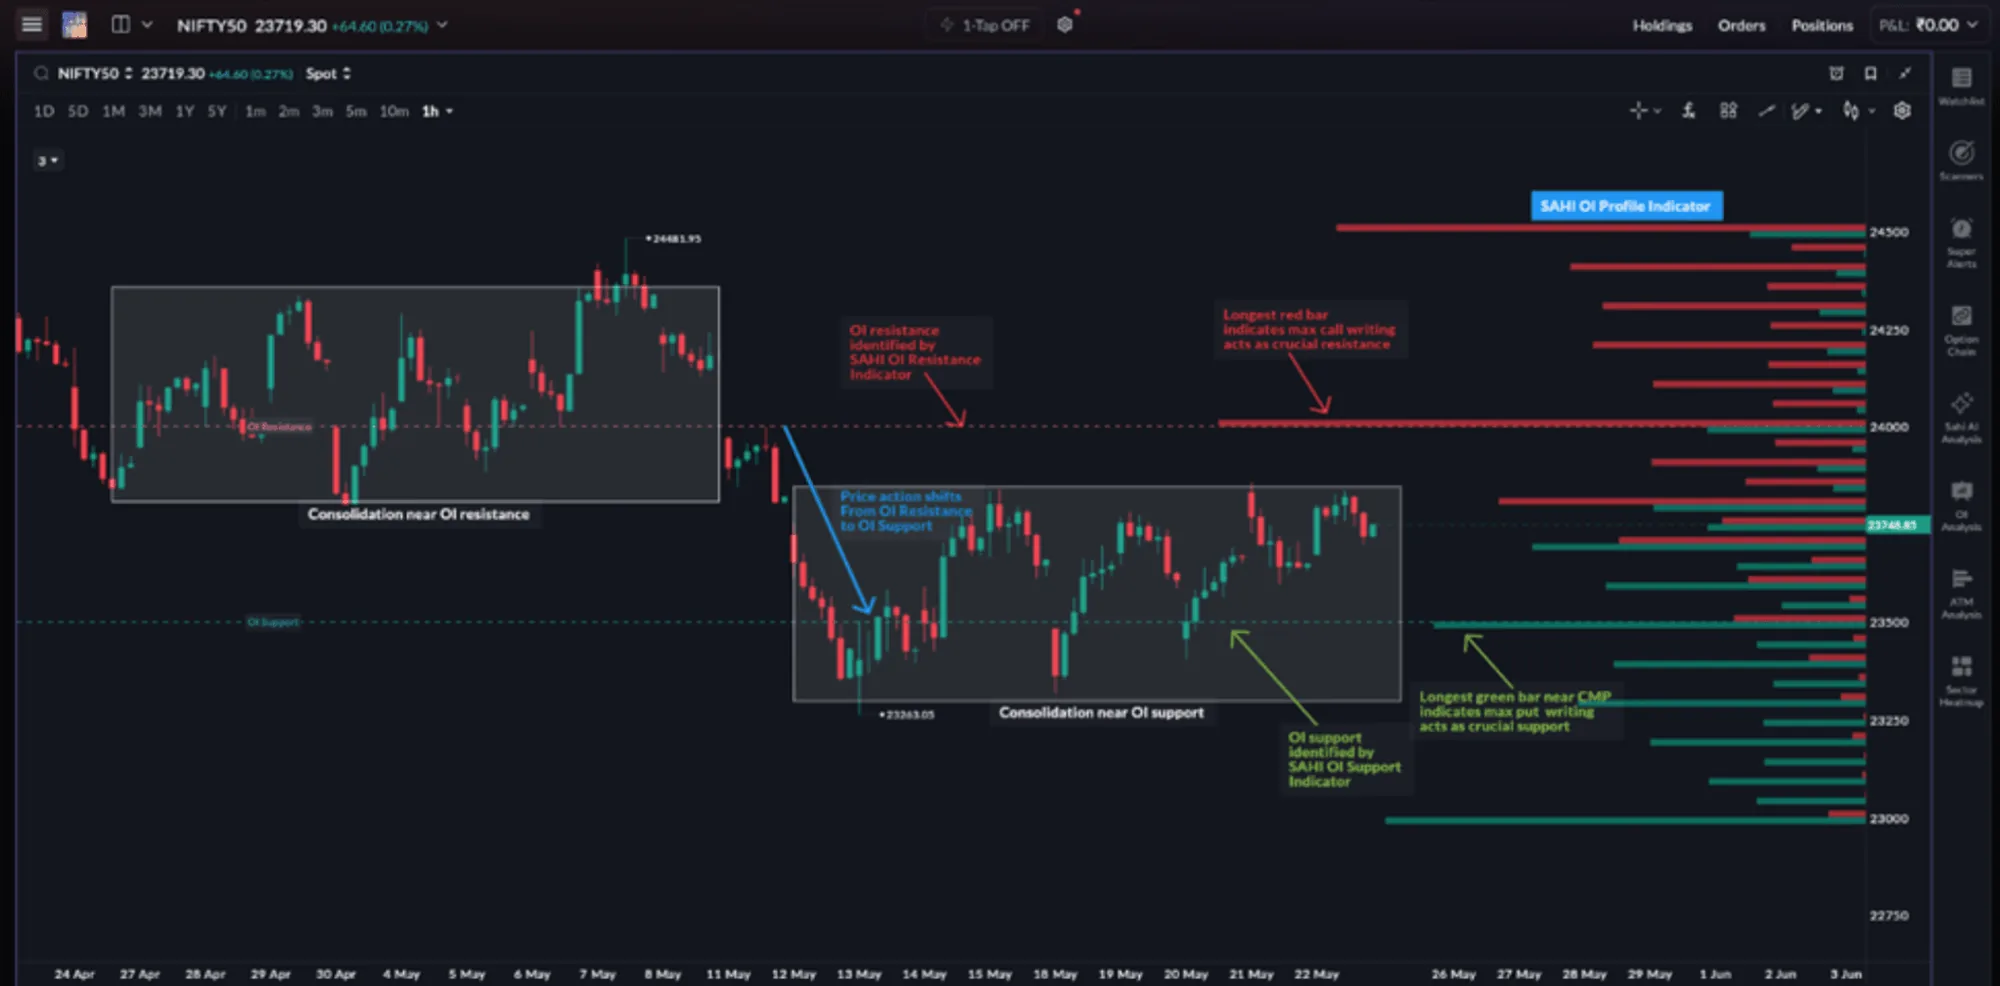
You can read these levels straight from the chain. SAHI also marks them on the chart through its automated OI Profile and Support & Resistance Indicator. In the example below, the indicator marks OI Resistance near 24,000 and OI Support near 23,500, the strikes with the strongest option-writing activity.
Now see how a wall behaves on a scalping chart. This sample uses the chain from the previous section, with the Call OI wall at 24,100.
- Up
- Down
- Call OI wall 24,100
- First test. Price rallies into 24,100. Over five candles the wicks reach the wall three times, but no candle closes above it.
- Lower high. About 14 candles later, price tries again and stalls just under 24,100, on lighter volume than the first test. Buyers are tiring.
- Back to the ATM strike. Volume picks up on the way down, and price returns to 24,000, the busiest strike in the chain.
For a scalper, the wall did two jobs. It warned against buying calls into 24,100, and the failed second test, a price action signal, offered a short-side scalp back towards 24,000.
OI walls are zones of interest, not fixed barriers. Mark them, then let the candles at the wall tell you whether it is holding.
Track OI shifts through the session
A common mistake is to treat OI levels as fixed for the day. OI changes all the time as positions are added, reduced or moved:
- A strike that had the highest Put OI at 9:30 AM may not hold that position by 12:00 PM.
- As price moves, writers often shift positions to strikes closer to the current price.
- A sharp directional move can cause fast unwinding at one strike and fresh build-up at another.
These shifts are not random. They reflect changing expectations. For example, if the highest Put OI moves from 25,000 to 25,100 and the highest Call OI moves from 25,200 to 25,300 a few hours later, traders are adjusting expectations upwards, even if the chart structure has not changed much. So do not rely on one snapshot. Watch how OI evolves.
A real snapshot comparison
Two snapshots of the NIFTY chain taken in the same session showed this (OI in lakh):
| Strike | Call OI | Later | Put OI | Later | How to read it |
|---|---|---|---|---|---|
| 23,800 | 48.06 | 39.61 | 112.54 | 67.15 | Both sides reduced; Put OI fell by about 40%, so support here weakened |
| 23,850 | 41.79 | 33.74 | 69.24 | 35.29 | Reduction on both sides; weaker conviction near the current price |
| 23,900 | 149.97 | 95.03 | 96.66 | 49.17 | Heavy unwinding on both sides; this strike lost much of its importance |
| 24,000 | 261.38 | 188.35 | 53.95 | 42.62 | Call OI fell but is still the largest in the table, so 24,000 stays the main resistance |
The sample chain, three hours later
Back to our illustrative chain. By about 12:30, with Nifty near 24,050, three rows have changed:
| Strike | Call OI 09:30 → 12:30 | Put OI 09:30 → 12:30 | What changed |
|---|---|---|---|
| 24,000 | 68 → 60 | 96 → 130 | Put writers moved up; 24,000 is now the highest Put OI, so support has shifted up from 23,900 |
| 24,100 | 132 → 104 | 24 → 42 | Call writers cut about a fifth of their position; the wall is weakening |
| 24,200 | 58 → 95 | 9 → 9 | Fresh call writing higher up; the next resistance is forming at 24,200 |
At the Reference Strike, Call OI is now falling and Put OI is rising: the bias has moved from neutral to bullish. The chart then shows what the shift meant.
- Up
- Down
- Wall before the break
- Same level after
- Pressing the wall. Price spends about 25 candles under 24,100, and the pushes get closer to it, while the chain shows call writers leaving.
- Breakout on volume. A candle closes above 24,100 on the tallest volume bar in this window.
- Quiet retest. About nine candles later, price dips back to 24,100 on light volume and closes above it. Old resistance is acting as support.
- Follow-through. Price moves on towards the new call wall forming at 24,200.
Price and OI together: the four build-ups
Beyond support and resistance, OI tells you whether a move is attracting fresh participation. A move backed by new positions is usually stronger than a move made only by traders closing old ones. Read the price and the OI of the same contract (a futures contract or a single option strike) together:
| Price | OI | Reading | What it usually means for a scalper |
|---|---|---|---|
| Rising | Rising | Long build-up | Fresh buyers are entering. The up-move has participation and may extend. |
| Rising | Falling | Short covering | Sellers are exiting. Moves can be fast but short-lived; take quick profits and keep stops tight. |
| Falling | Rising | Short build-up | Fresh sellers are entering. The down-move has participation and may extend. |
| Falling | Falling | Long unwinding | Buyers are exiting without fresh selling. Weak conviction; wait for new build-up before acting. |
Strong moves are often accompanied by fresh positioning. Analyse price and OI together, not one at a time.
Use the chain to confirm a setup
Once you have a bias, the chain helps you judge individual trades. The question is no longer "Is the market bullish or bearish?" It is "Does positioning support this particular setup?" A simple workflow:
- Identify the key OI support and resistance strikes in the chain.
- Map those levels onto the chart.
- Watch how price behaves around them: rejection, breakout or retest.
- Check whether OI at those strikes is strengthening or weakening.
- Confirm momentum with price action and your indicators.
- Select the strike, usually ATM or near ATM with good volume.
- Execute only when these factors line up.
The chain is only one part of the decision. It provides context. The trade itself still comes from structure, positioning, volatility and execution working together. Use OI to validate a trade idea, never to create one blindly.
When OI misleads, and what to avoid
OI is useful, but it has limits. Reading it becomes less reliable during:
- sudden expiry-day volatility;
- strikes with low volume;
- temporary intraday spikes in OI;
- major news events that cause rapid repositioning.
Strong OI levels can fail. Heavy resistance can break and support can disappear, usually when momentum and volatility become strong enough to overwhelm existing positions. The breakout chart above is exactly that.
OI is a context tool, not a prediction tool. It gives probabilities, not certainty. Price remains the final decision-maker.
Common mistakes
- Over-relying on the Put-Call Ratio (PCR). PCR can show broad sentiment, but it lacks the precision needed for intraday scalping. Acting on PCR alone, without looking at how OI is spread across strikes, often leads to weak entries.
- Using OI as a standalone signal. High OI at a strike does not mean price will reverse there. It only means there is positioning there. The reaction still needs confirmation from the candles.
- Ignoring price action. If price has broken a major OI level with conviction, holding the opposite view because the level still "looks strong" is a mistake.
- Reacting to every small OI change. OI moves all session. Small changes at single strikes are not actionable. Focus on meaningful shifts at the largest concentrations.
Checklist
- Read three columns: OI for positions, Change in OI for today's building, Volume for activity.
- Set a working bias from the Call and Put OI changes at the Reference Strike, then wait for price to confirm it.
- Mark the highest Put OI as likely support and the highest Call OI as likely resistance, as zones, not lines.
- Check the chain again during the session; a wall that is unwinding can break.
- Let the candles at the level decide. When price and positioning disagree, wait.
The option chain explains positioning. A complete scalp needs more: structure, volatility, Greeks, indicators, strike selection, execution and risk management in one workflow. The final chapter brings all of these together in one NIFTY trade on SAHI.
Questions
What is the most important column in the option chain for scalpers?
Open Interest and Change in OI are usually the most useful, because they show positioning and participation. Volume adds where the activity is right now.
Does the highest OI level always act as support or resistance?
No. It often behaves as an important level, but strong momentum and volatility can still break it, especially when writers at that strike start unwinding.
Should I use OI without looking at charts?
No. OI works best when combined with price action, structure and indicators.
Is PCR important for intraday scalping?
PCR can give a broad sentiment view, but it should not be treated as a standalone trading signal.
What is the biggest mistake traders make with the option chain?
Treating OI levels as guaranteed reversal zones instead of areas of interest that price still has to confirm.
Investor knowledge check
How well do you understand the markets?
Five quick questions on using OI, Change in OI and the option chain during live sessions. Under 3 minutes
-
Show answer
Answer: B. How market participants are positioned across strikes Charts show how price is moving. The option chain shows the positioning behind the move: where positions are being built, defended or unwound.
-
Show answer
Answer: D. A support zone The highest Put OI often acts as support and the highest Call OI as resistance, because traders holding large positions tend to defend these areas. They are zones of interest, not fixed barriers.
-
Show answer
Answer: A. Bullish: put writing is increasing and call resistance is weakening Rising Put OI with falling Call OI means support is strengthening below price while resistance weakens above it. Participants are more comfortable defending lower levels, which is a bullish intraday reading. Price still has to confirm it.
-
Show answer
Answer: C. OI shifts through the session as positions are added, reduced or moved, reflecting changing expectations OI levels are dynamic. The highest OI strike at 9:30 AM may not hold that position by noon, and a meaningful shift often signals that the day's dominant expectation is changing.
-
Show answer
Answer: A. Respect price action: strong momentum can overwhelm positioning, and price remains the final decision-maker Strong OI levels can fail when momentum and volatility overwhelm existing positions. Holding the opposite view only because the OI level looks strong is one of the most common option chain mistakes.
You got 0 of 5 right.
Read a live chainOpen the live option chain, find today's ATM strike and the two OI walls, and check them again in an hour.
Open the option chain