

Every earlier chapter covered one part of scalping: mindset and discipline (Chapter 2), risk and money management (Chapter 3), timing and chart structure (Chapter 4), Greeks (Chapter 5), market context and Vega (Chapter 6), indicators (Chapter 7), failure patterns (Chapter 8) and the option chain (Chapter 9). This chapter puts them to work inside one trade, using SAHI's tools end to end. The focus is how decisions are structured before, during and after execution.
The workflow at a glance
Nine steps, always in the same order. Each one has a clear "done" point before you move to the next.
- Pre-market. Check volatility and global cues, and write down a starting bias. Done when the bias is on paper.
- Levels. Mark OI support and resistance, key levels and the previous day's high and low. Done when the levels are on the chart.
- Setup. Wait for price to reach a level and show its hand: breakout, rejection or retest. Done when a candle closes and confirms.
- Strike selection. Pick a liquid ATM or near-ATM strike from the option chain. Done when the strike and premium are known.
- Entry. Enter on the confirming candle, not after the move has expanded. Done when the order is filled.
- Bracket order. Stop-loss and target go in with the entry. Done when both are live.
- Trade management. Watch structure, premium behaviour and OI shifts. Do not widen the stop.
- Exit. Target, stop, or a planned early exit when momentum fades. Done when the position is flat.
- Review. Record the trade and grade the execution, not the profit. Done when the journal entry is complete.
Set up the SAHI workspace
Organise the screen before the session for fast, clean execution. The core panels are:
- the Nifty (underlying) chart;
- the chart of the option you plan to trade;
- the option chain on the same screen;
- the order panel.
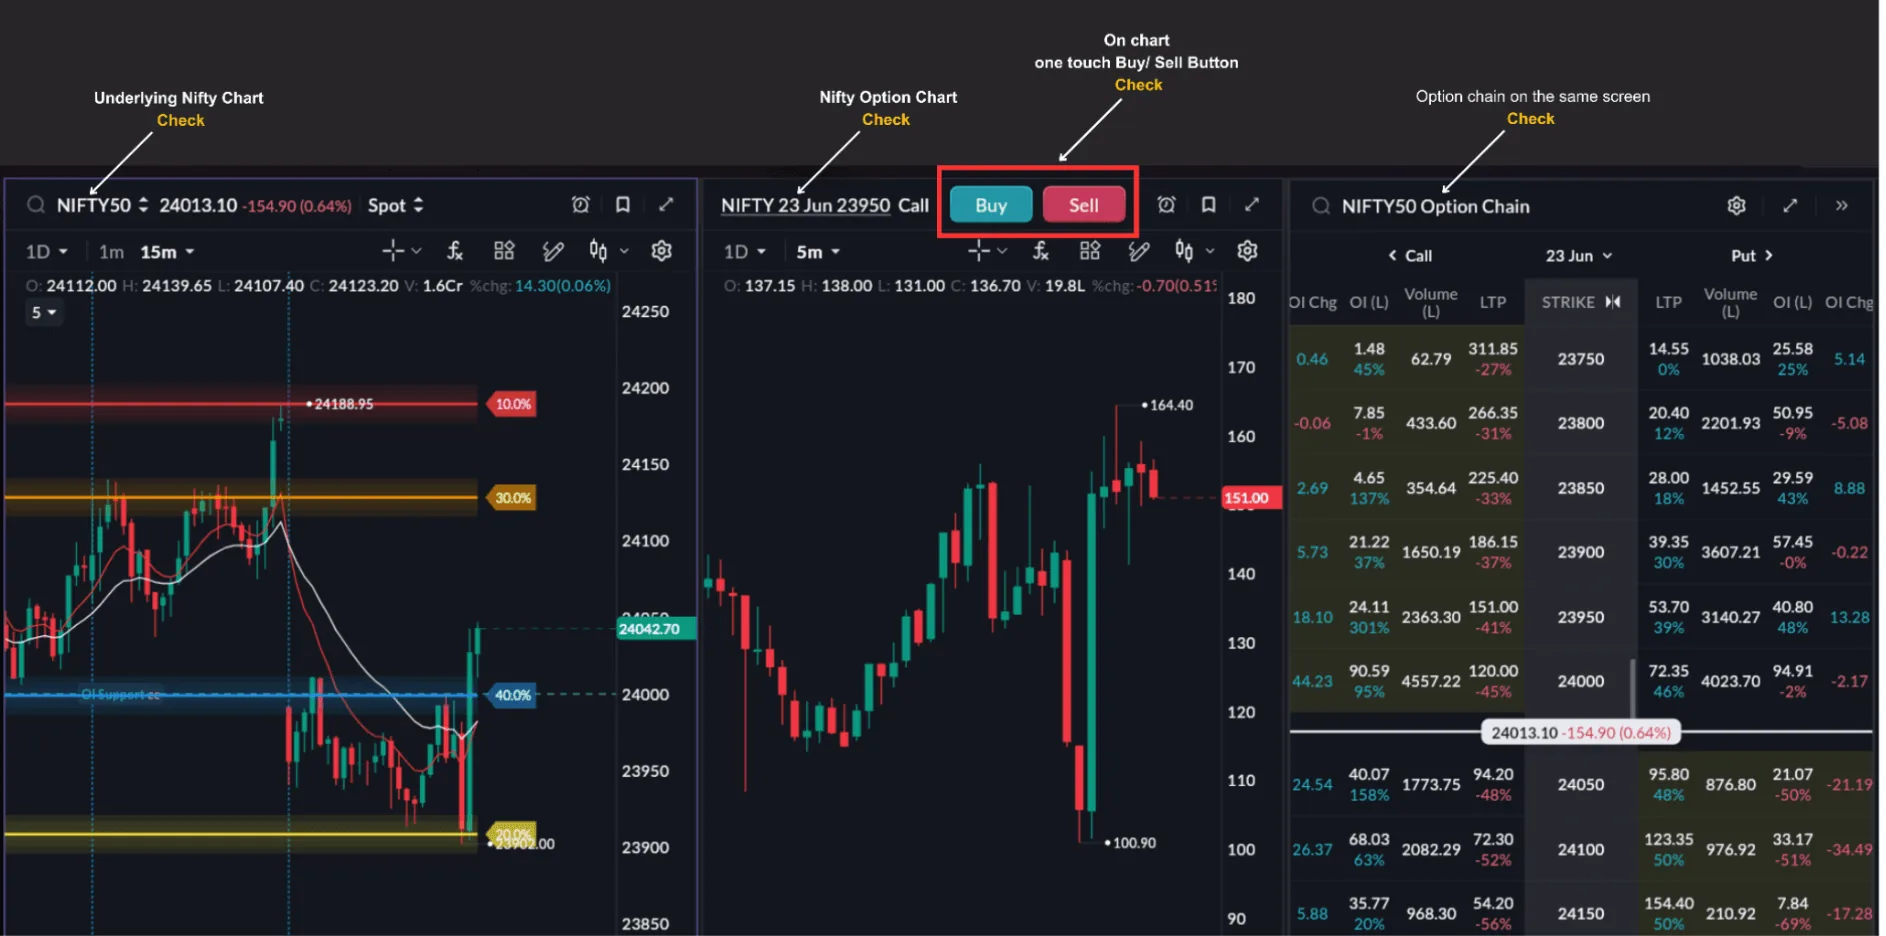
On SAHI, the underlying chart, the option's own price chart and the live option chain can be viewed together. You do not need to switch between a charting platform and a separate option chain window. In scalping, where speed and context matter more than any single indicator, this helps with:
- quick strike selection;
- clear sight of both underlying and option price action;
- faster order execution;
- less switching between charts, chain and trading panels.
If you scalp often, SAHI Scalper is SAHI's dedicated F&O scalping terminal, with in-house charts and 1-Tap execution from a single screen.
A well-built workspace can create a false sense of readiness. Having every tool on screen is not the same as having a setup. As Chapter 4 explained, the first 15 minutes are erratic: gaps fill, spikes reverse and structure has not formed. The workspace should be ready before 09:15. The first trade does not need to be.
Prepare before 09:15
This is the Daily Pre-Market Trading Checklist from Chapter 3, carried out on the SAHI workspace. Before the market opens:
- check India VIX and overall volatility conditions;
- look at global cues and Gift Nifty;
- use SAHI's OI Support & Resistance tool to find the major positioning levels;
- use SAHI's Key Levels Indicator to mark important support and resistance zones;
- note Max Pain positioning near expiry;
- form a starting bias for the session.
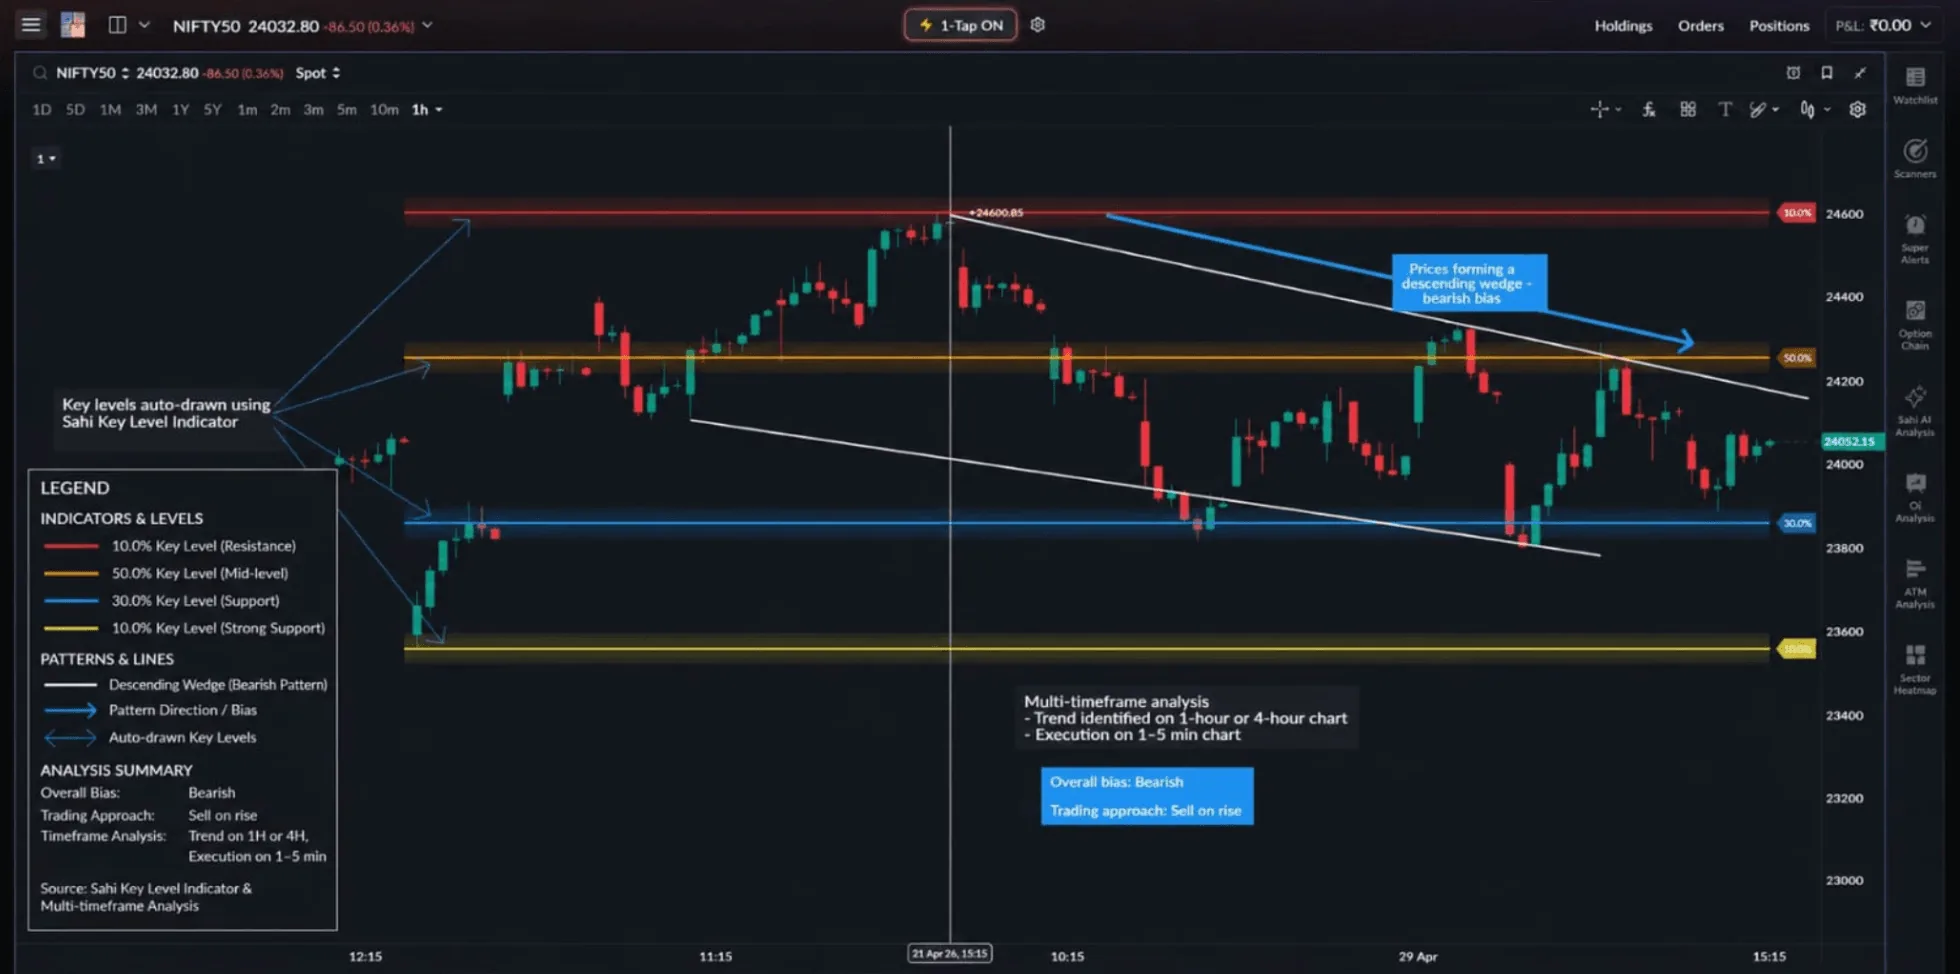
These levels become your reference points for the day, so trades are taken at planned zones rather than on live emotion. Once the market opens, Chapter 9's Reference Strike method turns the pre-market view into a working bullish, bearish or neutral bias.
Find the setup: price first, then the chain
First, name the market condition: trending, range-bound or a volatile expiry session. This is the trend-versus-chop read from Chapter 6, applied live.
The setup itself can vary, but the logic stays the same:
- price reaches a key level and reacts to it;
- the EMAs and VWAP agree with the direction;
- OI positioning supports the move;
- the option premium confirms momentum.
Example: when the chain and the chart disagree
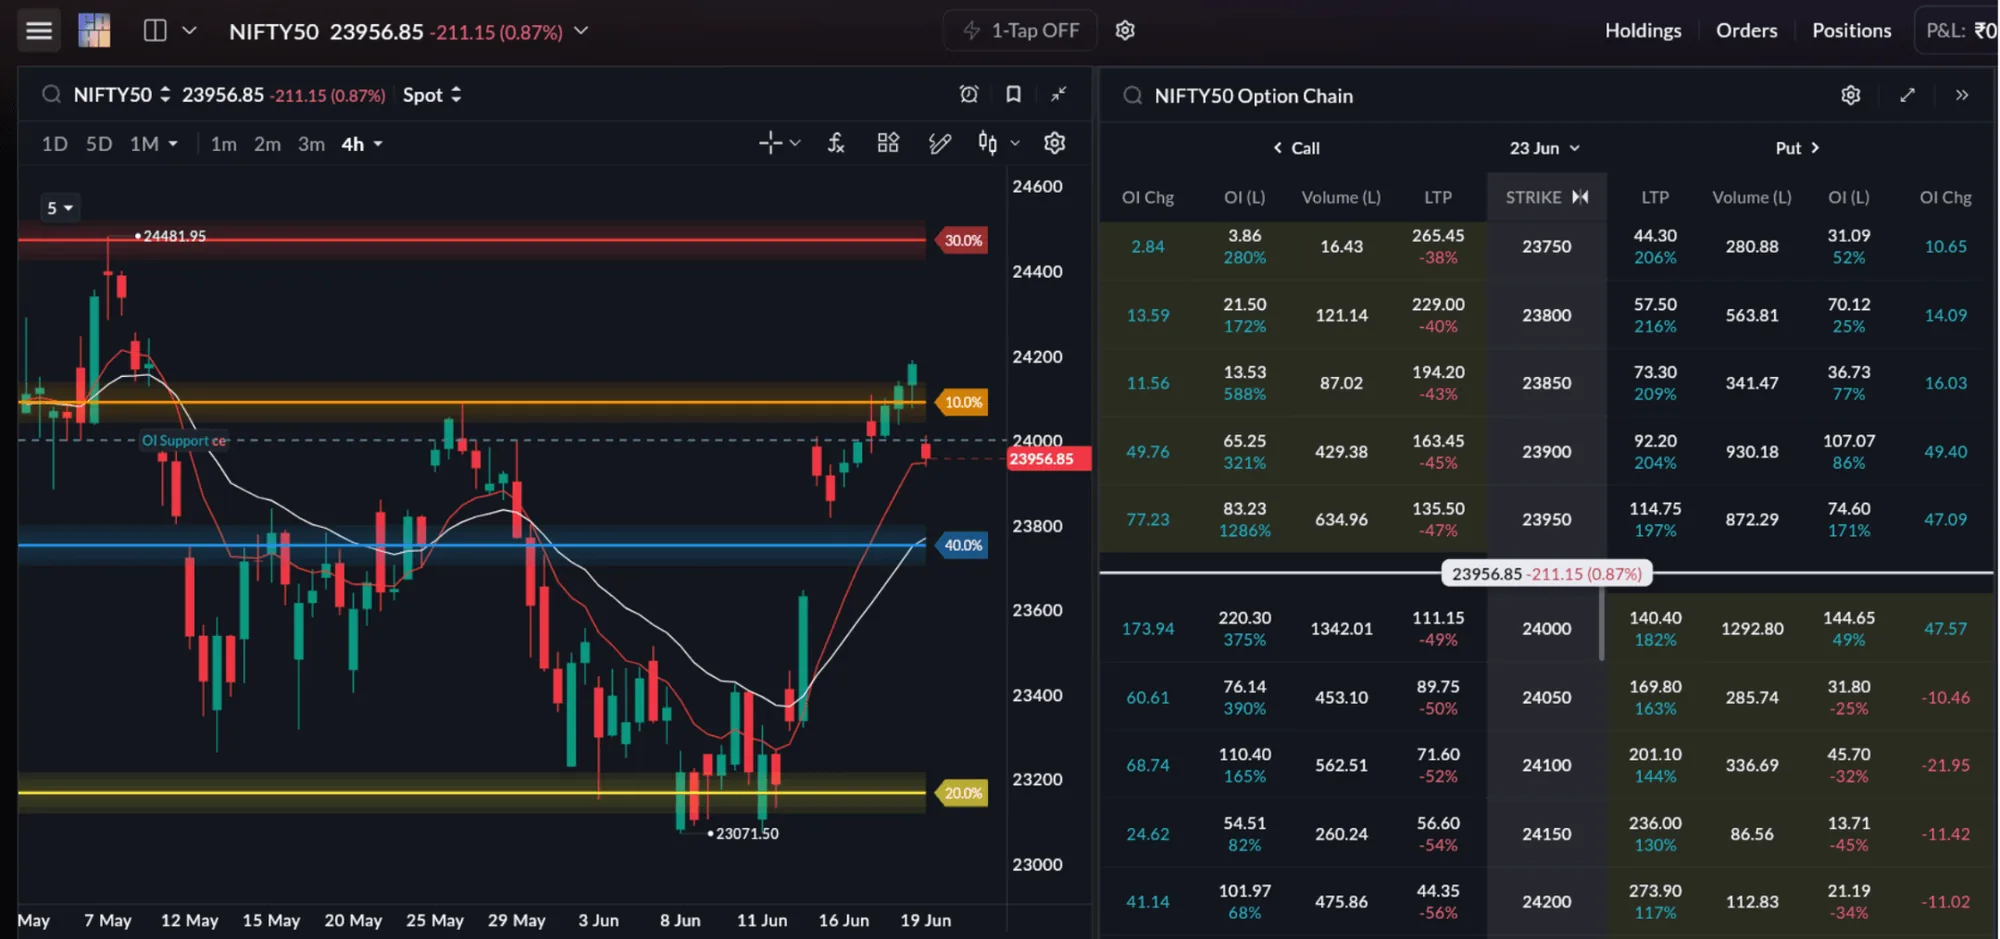
At the start of this session, the 24,000 strike had the highest OI and the largest fresh additions on both sides. Call writers were clearly stronger: about 220 lakh Call OI against 145 lakh Put OI, and Change in OI of about +174 lakh on Calls against +48 lakh on Puts. On positioning alone, resistance at 24,000 looked strong and a bearish bias seemed reasonable.
The chart said something different. Price was trading near SAHI's OI Support zone, and recent candles kept finding support near the rising 9 EMA. Price had not broken its support structure.
| Factor | Observation | Bias |
|---|---|---|
| 24,000 Call OI | 220 lakh vs 145 lakh Put OI | Bearish |
| Change in OI | +174 lakh Calls vs +48 lakh Puts | Bearish |
| SAHI OI Support | Price holding near OI support | Bullish |
| 9 EMA | Price respecting the EMA | Bullish |
| Overall | Mixed signals | No trade |
Shorting only because of heavy call writing would have been premature. Instead, wait for both to agree:
- Bearish trade: price breaks below SAHI OI Support and loses the 9 EMA while call writers continue to dominate.
- Bullish trade: price holds above support and the call writers' resistance starts to weaken through unwinding.
The option chain tells you how traders are positioned. Price action tells you whether that positioning is actually moving the market. When both agree, probability improves. When they disagree, patience is often the best position.
The pre-trade checklist
Run this pass before every scalp. It joins the self-assessment from Chapter 2 and the pre-market checklist from Chapter 3. One "no" means no trade.
| Check | Pass when |
|---|---|
| 1. Is the market condition clear? | You can name it: trending, range-bound or volatile expiry |
| 2. Am I at an important level? | Price is at a level you marked before the trade, not one found now |
| 3. Has a candle confirmed? | A candle has closed beyond the level or rejected it; you are not acting on a wick |
| 4. Does OI support the setup? | The wall in your way is not building; the one behind you is holding |
| 5. Are the indicators aligned? | EMAs and VWAP agree with the direction |
| 6. Is the strike responsive? | ATM or near-ATM, Delta near 0.5, heavy volume |
| 7. Is risk defined before entry? | Stop, target and size are worked out and within your per-trade limit |
| 8. Does premium behaviour support it? | The premium is moving with the underlying, not lagging it |
A full sample trade
Here is one trade from start to finish. The session, levels and premiums are made up for illustration; the process is the real point.
The plan before the open
- Levels: previous day's high at 24,070. From the option chain (the same sample chain as Chapter 9): Put OI wall at 23,900, Call OI wall at 24,100.
- Bias: neutral at the open; trade the side that price confirms.
- Risk: capital ₹2,00,000; risk per trade 1% = ₹2,000 (the Chapter 3 rule).
- VWAP
- 9 EMA
- 24,000 (support after the break)
- Resistance
- Breakout. After about 22 candles in a 23,950 to 24,000 range, a candle closes at 24,017 on the tallest volume bar of the session.
- Quiet retest. After one more push to 24,038, price slips back to 24,004 over three candles, on some of the lightest volume of the session. Sellers are not pressing.
- Entry. A bullish candle closes at 24,010, back above the 9 EMA, with VWAP below. Buy the 24,000 CE at ₹110.
- Target. Seven candles later Nifty trades up to 24,067 and the premium passes ₹134. The bracket order's target fills.
- Stall. Price then stalls under 24,070, the previous day's high, for about seven candles on falling volume, and drifts lower.
Step by step
- Setup. The range breaks upwards on volume (pin 1). Buying the breakout's second candle would have meant paying about ₹125 for the option: chasing. The plan is to wait for the retest.
- Strike selection. The ATM 24,000 CE. Its Delta is near 0.5, so it moves about half a rupee for each point in Nifty, and it carries the heaviest volume in the chain, which keeps spreads tight. A cheaper far OTM strike would barely react to a 50-point move.
- Entry. The retest holds 24,000 on light volume (pin 2) and the next candle closes up (pin 3). Buy at ₹110, directly from the option chain.
- Bracket order. The stop goes below the retest low of 23,998. With Delta near 0.5, about 24 Nifty points below the entry is roughly ₹12 on the premium, so the stop is ₹98. The target sits just below the 24,070 high, at ₹134, twice the risk.
The rupee arithmetic
Risk per unit = ₹110 − ₹98 = ₹12. Risk per lot = ₹12 × 65 = ₹780. Lots = ₹2,000 ÷ ₹780 ≈ 2.56, so 2 lots (130 units).| Item | Per unit | 2 lots (130 units) |
|---|---|---|
| Entry | ₹110 | ₹14,300 premium paid |
| Stop-loss | ₹98 (−₹12) | −₹1,560 maximum planned loss |
| Target | ₹134 (+₹24) | +₹3,120 planned reward |
| Reward to risk | 24 ÷ 12 | 2 : 1 |
| Result | Target filled at ₹134 | +₹3,120 before brokerage, taxes and charges |
The lot size of 65 units is the Nifty figure used in Chapter 3. Lot sizes are revised by the exchange from time to time, so always check the current lot size in the order window before you size a trade.
Manage the trade and exit
Risk is fixed before the trade begins. With SAHI's bracket order system, the stop-loss is placed immediately, the target is defined in advance and risk stays fixed during execution. This is Chapter 3's risk-per-trade and stop-loss framework made operational. Risk is not adjusted mid-trade because of confidence or because of how the position is behaving.
Once the trade is live, watch four things:
- Price structure: are candles still making higher highs above the level you bought?
- Premium behaviour: is the option moving with Nifty, or lagging it?
- OI shifts: is the wall ahead building or unwinding?
- Greeks: Gamma and Theta change premium behaviour quickly, more so on expiry days.
On SAHI charts an open position appears as an overlay with the entry price, live profit and loss, the stop-loss line and the target line, and the positions panel shows open P&L and premium movement.
What the Greeks did in the sample trade
From the entry close (24,010) to 24,058, Nifty rose 48 points and the premium rose about ₹26, a little more than the ₹24 that Delta alone would suggest. That extra is Gamma: as the option moves further into the money, its Delta rises and the premium speeds up.
After the target, price stalled under 24,070 and the candles compressed. When momentum stalls, that acceleration disappears and Theta, the daily time decay, starts working against a buyer, even though the underlying has not reversed. A trader still holding would have watched the premium slip back to about ₹116 within 11 candles of the target. This is the "holding too long" pattern from Chapter 8.
When to exit
- the target is reached;
- momentum weakens, for example several candles stall near a level;
- the structure breaks: the level you bought fails on a closing basis;
- premium behaviour changes significantly, such as the option no longer rising when Nifty does.
Decide your early-exit rules before entry. A stall near a key level, loss of momentum or a change in premium behaviour should already be part of the plan.
Review the trade
This is the Review and Refine stage from Chapter 2, and it does the same job as the trade journal in Chapter 3. The question changes from "Did I make money?" to "Did I execute the trade the way I planned?" That is what improves consistency over many sessions. Fill in a row like this after every trade:
| Field | Sample trade entry |
|---|---|
| Instrument and expiry | NIFTY 24,000 CE, nearest weekly expiry |
| Bias before the open | Neutral; walls at 23,900 and 24,100; previous high 24,070 |
| Setup | Range breakout above 24,000 on volume, light-volume retest |
| Entry and reason | ₹110; bullish close at the retest, above the 9 EMA and VWAP |
| Stop and target | ₹98 / ₹134 (2 : 1), placed as a bracket order with the entry |
| Size and risk | 2 lots; ₹1,560 at risk, within the ₹2,000 limit |
| Exit and reason | ₹134; target filled |
| Result | +₹3,120 before charges |
| Followed the plan? | Yes: waited for the retest, did not chase at ₹125, did not move the stop |
| What to repeat or change | Keep targets below the next marked level; price stalled at 24,070 |
| State of mind | Calm; no urge to re-enter after the exit |
A trade that loses can still be a well-executed trade. A trade that makes money after breaking the plan is a warning, not a success.
Execution mistakes to avoid
- Chasing entries after expansion. A breakout entered after it has already run is no longer a breakout trade, and the risk-reward has already worsened.
- Entering without confirmation. Wait for the candle to close.
- Delaying the stop-loss. The stop goes in with the entry, not after.
- Holding after momentum weakens. Theta does not wait.
- Overreacting during volatility spikes. Stick to the planned size and levels.
- Ignoring premium behaviour. An option that stops responding is telling you something.
- Cluttering the workspace. More tools on screen usually slow decisions down.
Each of these is covered in Chapter 8, and the sample trade above is built to avoid them. A trade run on a plan looks mechanical from the outside. The same setup traded reactively produces late entries, undefined stops and exits driven by hope rather than structure.
- Prepare before 09:15: bias, levels and risk limit on paper. The first trade can wait.
- Let price lead. Use the option chain to confirm, and stand aside when the two disagree.
- Trade a liquid ATM or near-ATM strike, and size the position from the stop, not from confidence.
- Place the stop-loss and target with the entry through a bracket order, and do not widen the stop.
- Exit on the target, the stop or a planned momentum rule. Then review the execution, not the P&L.
Questions
Do I need every SAHI tool mentioned in this chapter for every trade?
No. The tools exist to confirm a setup, not to manufacture one. Too many signals on screen usually slow decision-making rather than improve it.
What if the pre-market bias and the live setup disagree once the market opens?
Follow the live read. The pre-market bias is only a starting point, not a view to defend.
Why use a bracket order instead of placing the stop-loss and target separately?
A bracket order locks both in at the same time as the entry. That reduces the temptation to adjust them emotionally once the trade is live.
How do I know when to exit on momentum rather than waiting for the target?
Define it in advance. A stall near a key level, loss of momentum or a change in premium behaviour should already be part of the trade plan.
Is the sample trade meant to represent a guaranteed outcome?
No. It illustrates the workflow, not a promise of profit. A well-executed trade can still lose.
Investor knowledge check
How well do you understand the markets?
Five quick questions on bringing context, indicators, the option chain, execution and risk together in one trade. Under 3 minutes
-
Show answer
Answer: C. No trade: wait for price and positioning to agree before entering The signals are mixed: positioning is bearish but price has not confirmed weakness. When the option chain and price action disagree, patience is often the best position. Wait for both to agree.
-
Show answer
Answer: B. Its Delta near 0.5 reacts meaningfully to the move, and heavy activity at the strike keeps spreads tight Strike selection balances Delta, liquidity and positioning. The ATM strike responds meaningfully to the expected move, while a cheap OTM contract may barely react even when the direction is right.
-
Show answer
Answer: D. Stop-loss and target are locked in with the entry, keeping risk fixed and reducing emotional adjustment A bracket order puts the risk framework into practice: the stop-loss and target are defined before the trade is live, so risk stays fixed instead of being adjusted mid-trade on confidence.
-
Show answer
Answer: A. Gamma's acceleration fades and Theta starts working against the position, even without a reversal Once momentum stalls, the Gamma-driven acceleration disappears and time decay begins eroding the premium. This is the holding-too-long pattern from Chapter 8, and a momentum-based exit signal.
-
Show answer
Answer: C. Did I execute the trade the way I planned? The review grades execution, not P&L. A well-executed trade can still lose, and a consistent process is what improves results over future sessions.
You got 0 of 5 right.
Practise the workflowSet up the three-panel workspace on SAHI, mark tomorrow's levels tonight, and fill in the review table after each trade.
Open SAHI