

In scalping, things rarely go wrong in one obvious moment. A stop is placed a little late, a position is slightly too large, a losing trade is held because it might come back. None of these feels serious on its own. Across ten trades in a session, they decide the result.
Why small decisions add up
You are not taking one trade. You are taking several in the same session, so small decisions do not stay separate. A loss that should have been ₹1,500 becomes ₹3,000. The next trade is taken a little early to win it back. Then another. By the close, no single trade stands out, but the session is worse than it should have been.
Compare the two Nifty charts below. Both start from a similar idea and entry. The difference shows up once price moves against the position.
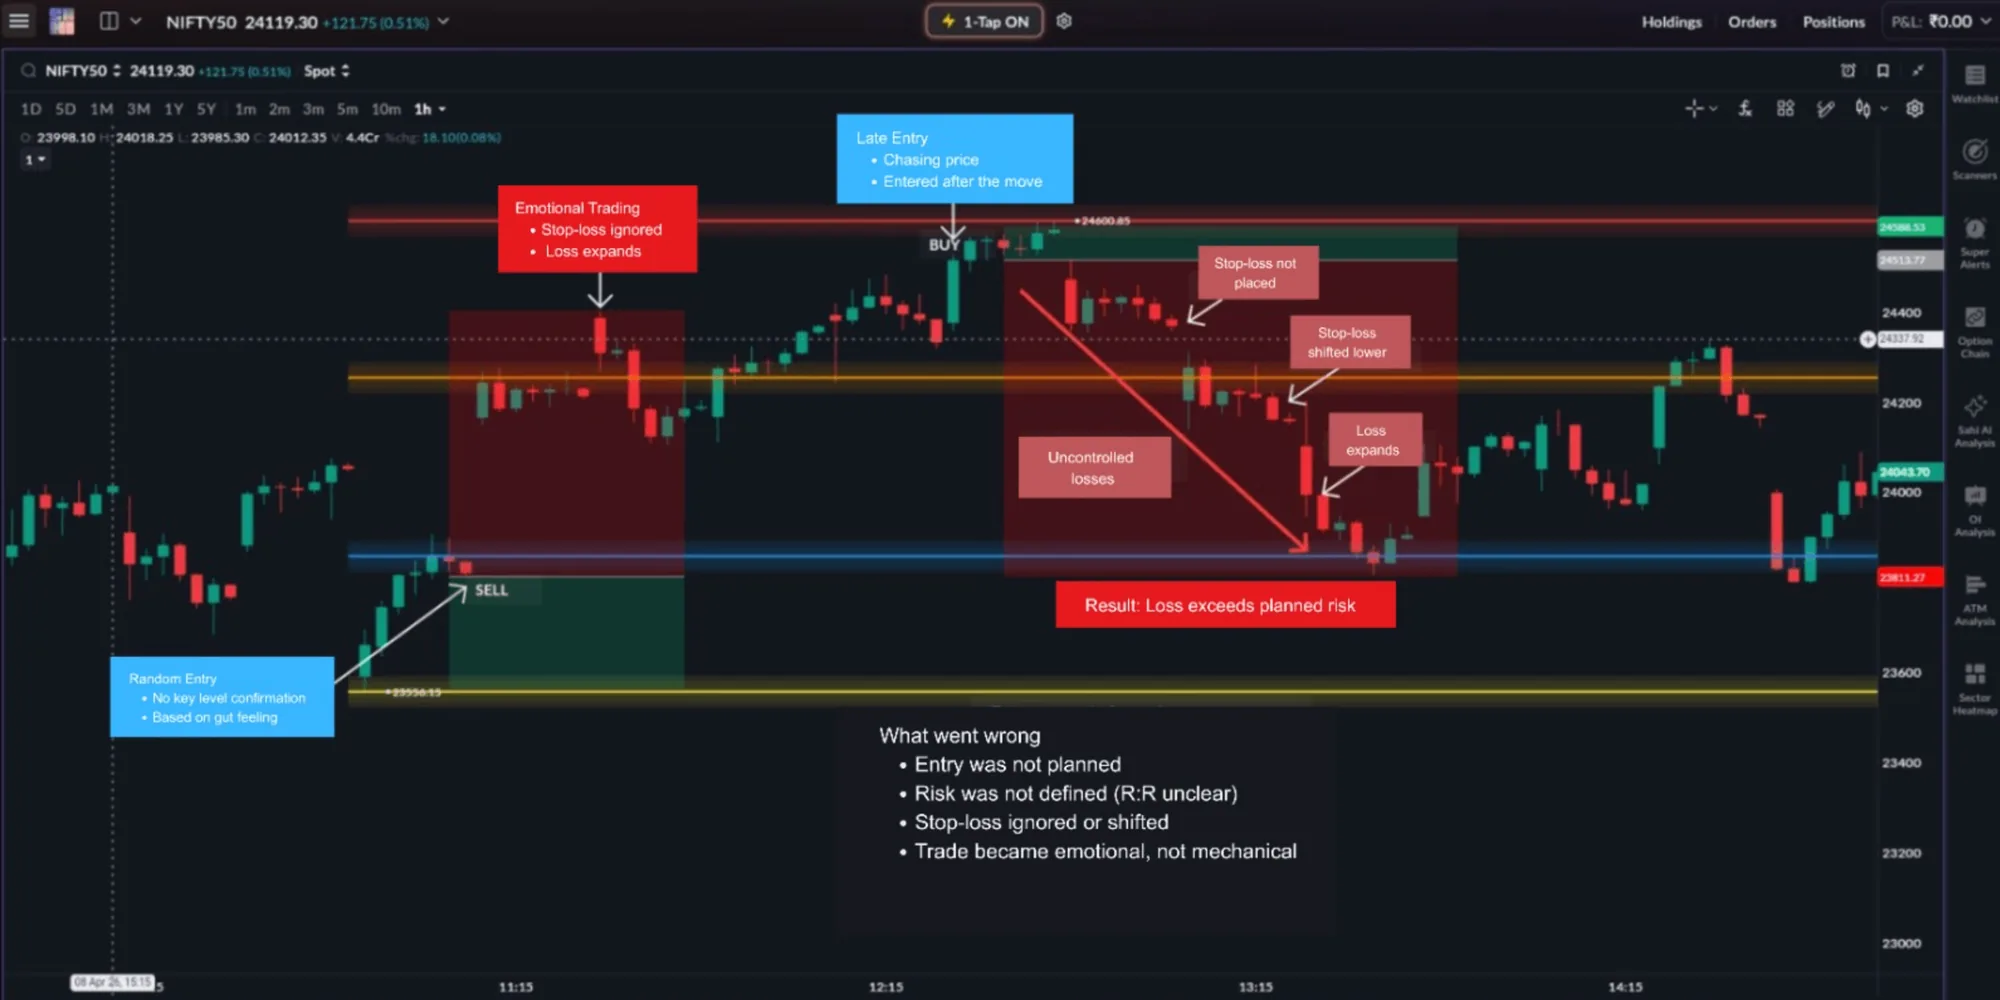
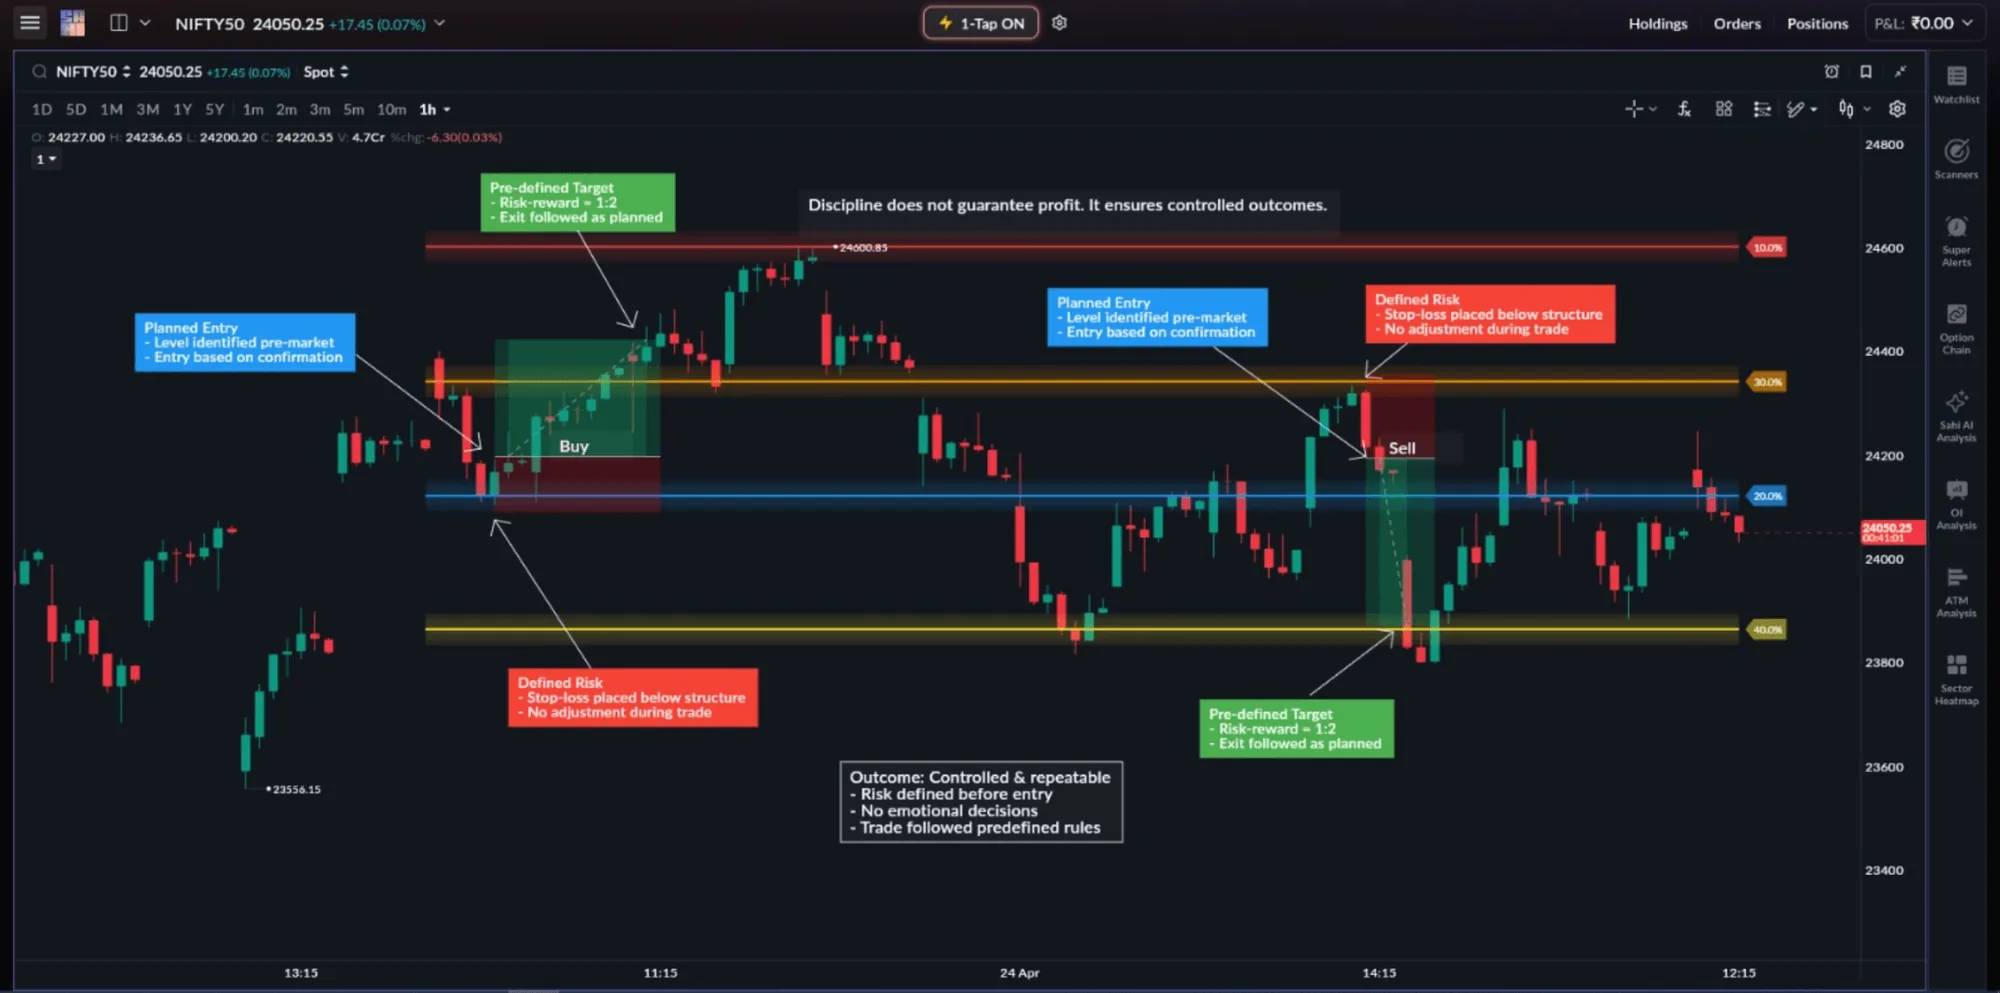
Discipline does not guarantee profit. It keeps every loss at the size you planned, so that one trade can never undo a whole session.
Fix your risk per trade
Every risk framework starts with one question: how much will you lose on this trade if it fails? Scalpers usually fix this as a percentage of total capital, typically 0.5% to 2% per trade.
Risk per trade (₹) = Trading capital × Risk %
| Capital | Risk % | Maximum loss per trade |
|---|---|---|
| ₹2,00,000 | 0.5% | ₹1,000 |
| ₹2,00,000 | 1% | ₹2,000 |
| ₹2,00,000 | 2% | ₹4,000 |
This chapter uses 1%, or ₹2,000, for its examples. The number is set before the trade and stays the same from trade to trade. It does not change with your confidence, the market's mood, or your last win or loss.
What a losing streak does
Five losses in a row happen to every trader sooner or later. Here is what the same streak does at two risk levels, for illustration:
| Risk per trade | 5 losses | Capital left | Gain needed to recover |
|---|---|---|---|
| 1% (₹2,000) | ₹10,000 | ₹1,90,000 | ₹10,000 ÷ ₹1,90,000 = 5.3% |
| 5% (₹10,000) | ₹50,000 | ₹1,50,000 | ₹50,000 ÷ ₹1,50,000 = 33.3% |
At 1%, the streak is an ordinary bad day. At 5%, a quarter of the account is gone, and you now need a one-third gain just to get back to where you started. A fixed, small risk keeps any one trade from damaging the account and gives your method enough trades to show whether it works.
Place the stop where the idea fails
Once the rupee risk is fixed, decide where the trade is wrong. The stop-loss is not a number chosen for comfort. It sits at the price where the reason for the trade no longer holds:
- Long trades: just below the support or swing low that the setup depends on.
- Short trades: just above the resistance or swing high.
- Range or consolidation setups: outside the structure that defines the setup.
A fixed rupee stop, such as ₹500 or ₹1,000 on every trade whatever the chart shows, causes two problems. If it is too tight, normal fluctuation takes you out before the idea has been tested. If it is too wide, the loss is larger than it needs to be. Price moves by structure, levels and liquidity, not by your rupee number.
- Up
- Down
- Support
- Tight fixed stop
- Structure stop
- Support. Price falls to about 23,965 and the candle leaves a long lower wick (low 23,962). Seven candles later a second test holds a little higher, at 23,966.
- Entry. The candle after the second test closes back up at 23,985. The idea: support holds. The structure stop goes below both lows, at 23,955, a risk of 30 points.
- The normal dip. Three candles after entry, a wick drops to 23,968. A tight 15-point stop at 23,970 is hit here. The structure stop is untouched, and support has not broken.
- Target. Thirteen candles after entry, price reaches 24,045, a 1:2 target (60 points against 30). Only the trade with the structure stop is still open to collect it.
A wider stop does not mean a bigger loss. You keep the rupee risk the same by trading fewer lots, which the next section shows.
Work out your position size
Position size is not chosen by margin, premium or instinct. It comes out of a short calculation, done before the trade.
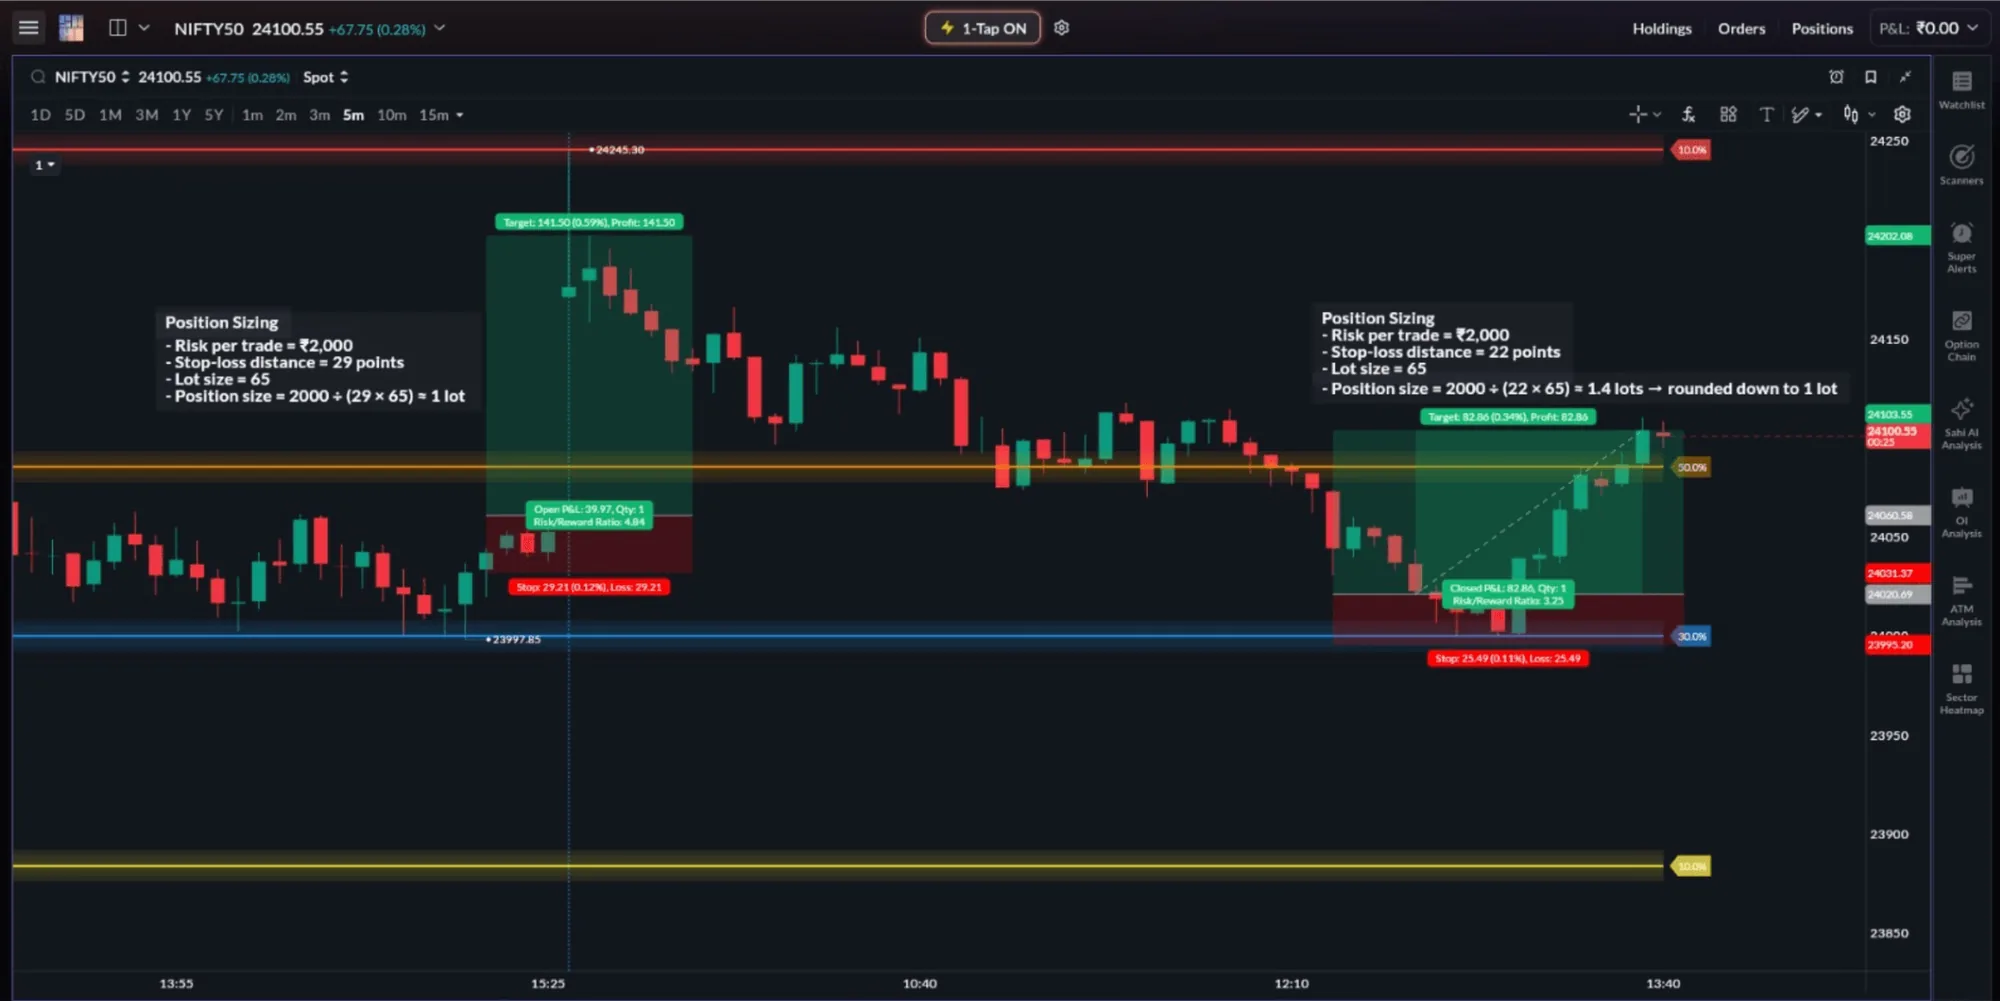
Lots = Risk per trade ÷ (Stop distance in premium points × Lot size)
A worked example on a Nifty option, with illustrative numbers. You buy at a premium of ₹120 and your stop is at ₹100.
| Step | Working | Result |
|---|---|---|
| 1. Risk per trade | 1% of ₹2,00,000 | ₹2,000 |
| 2. Stop distance | ₹120 − ₹100 | 20 points |
| 3. Risk for one lot | 20 × 65 units | ₹1,300 |
| 4. Lots allowed | ₹2,000 ÷ ₹1,300 | 1.53 |
| 5. Round down | Lots cannot be split | 1 lot, risk ₹1,300 |
Two lots would put ₹2,600 at risk, above the ₹2,000 limit. Rounding down keeps the trade inside the plan. The lot size of 65 is the Nifty 50 lot used in the original example; always check the current lot size on the contract before you trade.
Measure the stop in the instrument you are trading. If you plan the trade on the Nifty chart, the option premium usually moves less than the index. An at-the-money option often moves roughly half as much (its delta, covered in Chapter 5), so a 40-point stop on the index is closer to 20 points on the premium. Using index points in the formula, as in the screenshot below, overstates the rupee risk: it errs on the safe side.
The cheap-premium trap
An option at ₹10 feels cheaper than one at ₹100, so traders buy more lots of it. But the premium does not define the risk; the stop distance and the number of units do. Say you buy 10 lots of a ₹10 option because "it is cheap":
A fall of just ₹4: 4 × 65 units × 10 lots = ₹2,600 lost
That is more than the whole ₹2,000 budget, from a ₹4 move. Size every trade with the formula, whatever the premium.
Win rate, reward-to-risk and costs
Scalping is built on small, repeated gains. That leaves little room for error, so check that your method can pay before costs, and then after them.
How often must you win?
The reward-to-risk ratio (R:R) compares what you aim to make with what you risk. At 1:2 you risk ₹1,000 to make ₹2,000. The higher your R:R, the fewer trades you need to win to break even.
Break-even win rate = 1 ÷ (1 + R), where R is reward ÷ risk (before costs)
| Reward-to-risk | Working | Win rate needed to break even |
|---|---|---|
| 1:1 | 1 ÷ 2 | 50% |
| 1:1.5 | 1 ÷ 2.5 | 40% |
| 1:2 | 1 ÷ 3 | 33% |
| 1:3 | 1 ÷ 4 | 25% |
Now ten trades at ₹1,000 risk and a ₹1,500 target (1:1.5), with about ₹30 of costs per trade. Round numbers, for illustration:
| Win rate | Wins | Losses | Costs | Net |
|---|---|---|---|---|
| 40% (4 of 10) | 4 × ₹1,500 = ₹6,000 | 6 × ₹1,000 = ₹6,000 | 10 × ₹30 = ₹300 | −₹300 |
| 50% (5 of 10) | 5 × ₹1,500 = ₹7,500 | 5 × ₹1,000 = ₹5,000 | 10 × ₹30 = ₹300 | +₹2,200 |
At exactly the break-even win rate, costs turn the session negative. You need an edge above break-even, not at it.
One trade handled differently
A few trades go to plan and small gains build. Then one trade is handled differently: the stop is not followed, or the position is held in the hope that it turns. For illustration, three trades at ₹1,000 risk:
| Session | Two winners | Third trade | Net |
|---|---|---|---|
| Stop followed | +₹3,000 | −₹1,000 | +₹2,000 |
| Stop ignored | +₹3,000 | −₹3,500 | −₹500 |
This is how many sessions turn from slightly positive to negative. Take trades only when the setup's conditions are met, place the stop and follow it, exit at the target or when the trade becomes invalid, and do not hold a scalp in the hope of turning it into a larger move.
Costs on every round trip
In Indian options, every trade carries brokerage, STT, exchange charges, GST, stamp duty and the SEBI fee. For a scalper these repeat on every trade. Here is one illustrative round trip of 1 lot of Nifty options, assuming a flat ₹10 brokerage per order and about ₹2,500 of premium on each side:
| Charge | Rate | Buy (₹) | Sell (₹) | Total (₹) |
|---|---|---|---|---|
| Brokerage | Flat | 10.00 | 10.00 | 20.00 |
| STT | 0.15% (sell) | 0.00 | 3.75 | 3.75 |
| Exchange transaction charges | ~0.05% | 1.25 | 1.25 | 2.50 |
| GST | 18% on (brokerage + transaction) | 2.03 | 2.03 | 4.06 |
| Stamp duty | 0.003% (buy) | 0.08 | 0.00 | 0.08 |
| SEBI fee | Approx. | 0.00 | 0.01 | 0.01 |
| Estimated total | 13.36 | 17.03 | 30.39 |
About ₹30 a round trip looks small. On a ₹100 gross profit it is 30% of the gain. Across ten trades it is about ₹300 a session, which is exactly what turned the 40% session above from zero to a loss.
Charges are illustrative and change from time to time; check the current rates and SAHI's pricing before you rely on them. If your plan has lower or zero brokerage, the brokerage and its GST fall away and the total is lower.
The pre-market routine
Most execution mistakes during a session trace back to what was not decided before the open. By 09:15 you should already know where the key levels are, what kind of conditions to expect, and how much you are prepared to lose today. Then price reaching a level is something you marked earlier, not something you work out under pressure.
| Area | What to check | What to look for | What it changes |
|---|---|---|---|
| Volatility | India VIX | Above 18–20 (high) or below 15 (low) | High: fewer lots, wider stop. Low: normal lots, tighter stop. |
| Sentiment | Global cues and Gift Nifty | Bullish, bearish or neutral | Whether to expect a gap-up, gap-down or flat open. |
| Levels | Support and resistance, PDH and PDL, supply and demand zones | Where price is likely to react | Your breakout, retest and reversal points, and the no-trade zones in between. |
| Option data | Option chain | Heavy OI strikes, PCR, max pain | Where large writers have built floors and ceilings. |
| Discipline | Risk limits | Maximum loss and maximum trades for the day | When the session ends, decided now. |
PDH and PDL are the previous day's high and low.
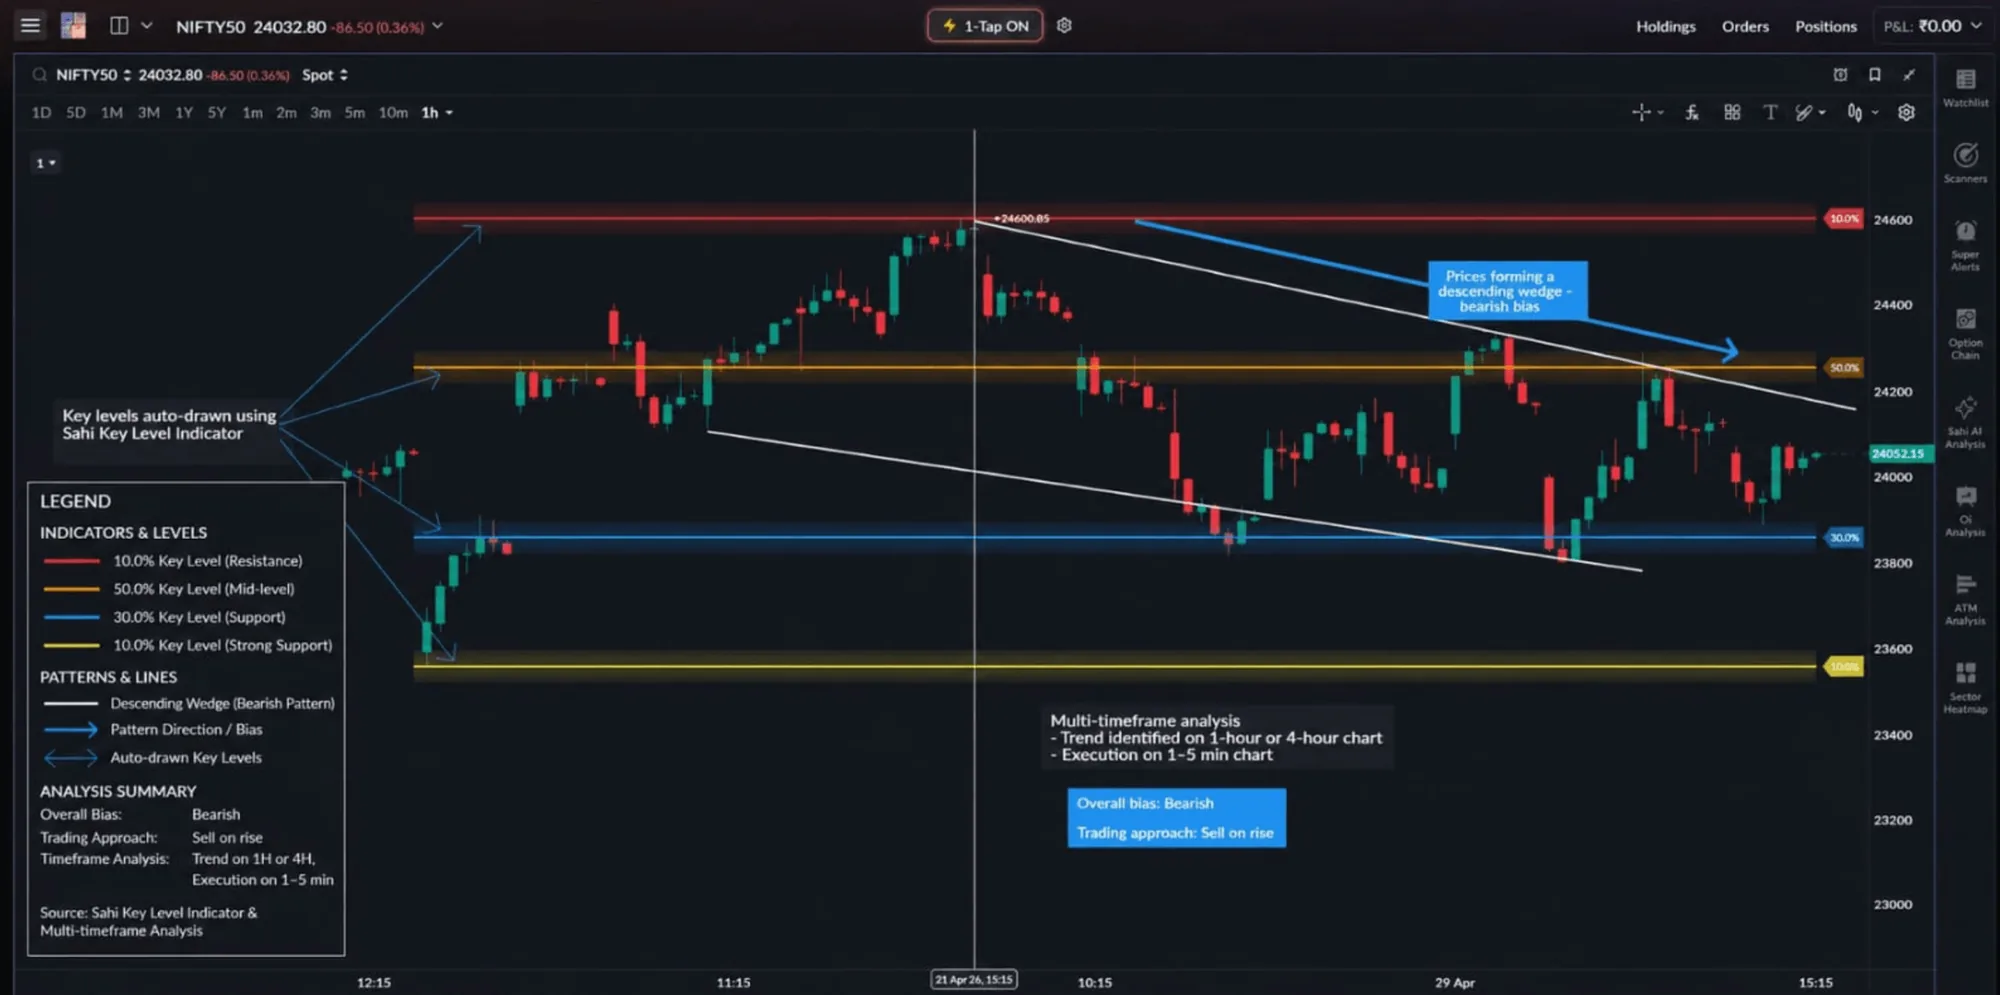
With this done, entries come at the level rather than after it, and there is less need to justify a trade after you have taken it. Without it, trades are built around whatever price is doing in the moment: entries are late, exits are uncertain, and small gains are hard to keep.
Daily limits and the Kill Switch
Risk per trade protects each trade. Two more limits protect the session. They are not precautions for bad days; they are what stop a bad day from becoming a bad week.
- Maximum number of trades. It prevents overtrading on days when setups are not clear. When the count is reached, the session ends, however the market looks.
- Daily loss limit (daily drawdown). The rupee loss at which you stop for the day. After a few losses in a row, the urge to win it back leads to impulsive trades that drift away from the plan.
A worked example with the numbers used in this chapter. The multiples are a common way to set the limit, not a rule; choose yours before the open:
| Limit | Working | For illustration |
|---|---|---|
| Risk per trade | 1% of ₹2,00,000 | ₹2,000 |
| Daily loss limit | 3 full losses: 3 × ₹2,000 | ₹6,000 (3% of capital) |
| Maximum trades | Set in advance | 6 trades |
| Worst week | 5 sessions at the limit: 5 × ₹6,000 | ₹30,000 (15%): a signal to stop and review the method |
The limit applies to the session's net P&L. If you are up ₹3,000 and then lose ₹5,000, the session is at −₹2,000, and that counts towards the ₹6,000 limit.
Once a limit is reached, the session ends. Not paused, not reviewed mid-session: it ends. The market will be there tomorrow. Your capital needs to be there too.
This is where SAHI's Kill Switch helps. Once your predefined loss limit is reached, it lets you disable trading in a selected segment for the rest of the day. The aim is simple: take the decision out of your hands at the moment you are least able to make it well, and prevent revenge trading and overtrading after losses.
In practice:
- Set a maximum number of trades and a daily loss limit in rupees before the open.
- Stop trading as soon as either limit is reached.
- Use the Kill Switch to enforce the limit, rather than relying on willpower.
- Never change either limit during the session.
Keep a trade journal
Once the session is over, the only way to know what actually happened is to review the trades. A trade journal is a simple record of each trade and how it was executed. It is one of the most effective ways to improve, and one of the first habits traders drop.
Most traders remember the profit or loss and forget the process. A journal moves the question from "Did I make money?" to "Did I execute the trade the way I planned?" Without a record, mistakes repeat, good practices go unnoticed and improvement is random. With one, patterns in your execution become clear, you see which setups actually work, and consistency builds.
One row per trade is enough. An illustrative entry:
| Field | Example |
|---|---|
| Market and contract | Nifty weekly call option |
| Time in and out | 09:42 to 09:51 (9 one-minute candles) |
| Setup and reason | Retest of the previous day's high after a breakout |
| Entry, stop, target | ₹120, ₹100, ₹150 (1:1.5) |
| Exit and result | ₹150; 30 × 65 = +₹1,950 for 1 lot, before costs |
| Execution quality | Followed the plan: yes. Stop moved: no. |
Reviewed every session, the journal shows what you cannot see live: whether stops are followed or moved in the moment, which time windows suit you, and which setups behave differently in certain conditions. Keep it simple; consistency matters more than detail.
With risk fixed at the trade and session level, the structure is in place. What remains is when to act and what to look for. That is the next chapter: timing, candle patterns and chart structures.
Checklist
- Fix your risk per trade at 0.5% to 2% of capital, in rupees, before the open.
- Place the stop where the setup fails: below support for longs, above resistance for shorts.
- Size the trade with the formula and round down: Lots = Risk ÷ (Stop points × Lot size).
- Know your break-even win rate for your reward-to-risk, and count about ₹30 of costs a round trip.
- Set a daily loss limit and a maximum number of trades; when either is hit, the session ends.
- Journal every trade and review execution, not just profit and loss.
Questions
Can I use a fixed stop-loss in rupees for every trade?
You can, but it causes problems over time. A fixed rupee stop is too tight for some setups and too wide for others. Place the stop where the trade becomes invalid, then keep the rupee risk fixed by adjusting the number of lots.
What if my position size comes out to less than one lot?
Then the trade does not meet your risk rule at your current capital. Skip it and wait until your capital grows, or look for a setup with a tighter structure stop that allows at least one lot within your limit. Forcing the trade with more risk than the framework allows defeats the purpose of having one.
Does the daily loss limit include all trades, or just losing ones?
All trades. It is applied to the net P&L for the session. If you are up ₹3,000 and then give back ₹5,000, the session is at −₹2,000, and that is the figure measured against the limit.
How detailed should the trade journal be?
Enough to review what happened and why. Entry, exit, stop level, setup type, time, and a one-line note on execution are usually enough. The aim is a record you can review across sessions, not an essay after every trade.
What if I hit the daily loss limit early in the session?
The session ends. This is exactly the situation the limit exists for. Afterwards, note what led to the losses and whether the trades met the conditions in your pre-market plan. A limit reached early is a reason to review, not a reason to override the rule.
Scalping knowledge check
How solid is your risk framework?
Five quick questions on risk per trade, stop-losses, position sizing and daily limits. Under 5 minutes
-
Show answer
Answer: C. A fixed 0.5%–2%, decided before the trade. Risk per trade is a fixed share of capital, set before the trade. It does not change with confidence, conditions, or recent wins and losses.
-
Show answer
Answer: B. At the level where the market structure breaks. The stop sits where the trade idea no longer holds: below support for longs, above resistance for shorts, outside the structure that defines the setup.
-
Show answer
Answer: A. 1 lot. ₹2,000 ÷ (20 × 65) = ₹2,000 ÷ ₹1,300 ≈ 1.53 lots. Lots cannot be split. One lot risks ₹1,300 and stays within the limit; two lots risk ₹2,600 and break it.
-
Show answer
Answer: D. Stop trading for the day. This is exactly the situation the limit exists for. SAHI's Kill Switch can enforce it by disabling trading in a segment for the rest of the day.
-
Show answer
Answer: B. To review execution against the plan. A journal moves the question from "Did I make money?" to "Did I execute the trade the way I planned?", so execution patterns, working setups and repeated mistakes become visible.
You got 0 of 5 right.