

A good scalp needs the right time, the right instrument and the right setup at the right level. Miss one of them and the same pattern that works at 09:45 fails at 12:30.
What a scalp needs
Options scalping depends on three conditions being present together:
- Liquidity: enough buyers and sellers that your order fills at a fair price, with a tight bid-ask spread.
- Movement: enough range in the underlying for the premium to reach your target in a few candles.
- Readable behaviour: price respects levels, so breakouts, retests and rejections mean something.
These conditions do not exist equally through the day. They concentrate in particular windows. Outside them the market is either too erratic to read or too slow to pay. Trading more in those periods does not add opportunity; it adds noise and costs.
The trading windows
The Indian equity market trades from 09:15 to 15:30. Here is how a typical index session divides up, with the length of each phase in candles on a 3-minute chart:
| Time | 3-min candles | What the market does | What to do |
|---|---|---|---|
| 09:15 – 09:30 | 5 | Overnight news and global cues priced in at once. Gaps, spikes, quick reversals. | Observe only. Mark levels. |
| 09:30 – 10:15 | 15 | Direction appears, levels hold, volume is high, spreads are tight. | Best window. Trade clean setups. |
| 10:15 – 11:30 | 25 | The morning trend may continue, but volume fades. | Moderate. Be selective. |
| 11:30 – 13:30 | 40 | Low volume, wider spreads, choppy price with no follow-through. | Avoid. The dead zone. |
| 13:30 – 14:30 | 20 | Activity starts to return. | Selective. Range breakouts only. |
| 14:30 – 15:15 | 15 | Institutions adjust or close positions. Volume returns, moves complete faster. | Good window. Watch time decay. |
| 15:15 – 15:30 | 5 | The last minutes can be unpredictable. | No new entries. |
The two prime windows add up to about an hour and a half. That is your real trading time; the rest of the session is for preparation, patience and selective trades.
- Up
- Down
- Prime windows
- The opening phase. The second candle runs up to close at 24,150; the third gives all of it back and closes at 24,046. The volume bars are the tallest of the day. There is movement, but no structure.
- Window 1 (09:30 to 10:15). Over 15 candles price trends from about 24,055 to 24,224 mostly with higher highs and higher lows. Levels hold and pullbacks are shallow.
- The dead zone (11:30 to 13:30). For 40 candles price stays inside a band of about 50 points, and average volume is less than half that of Window 1. Patterns form here but go nowhere.
- Window 2 (14:30 to 15:15). Volume returns, about three times the midday average, and price breaks above the midday range, rising to about 24,316.
Opening phase: 09:15 to 09:30
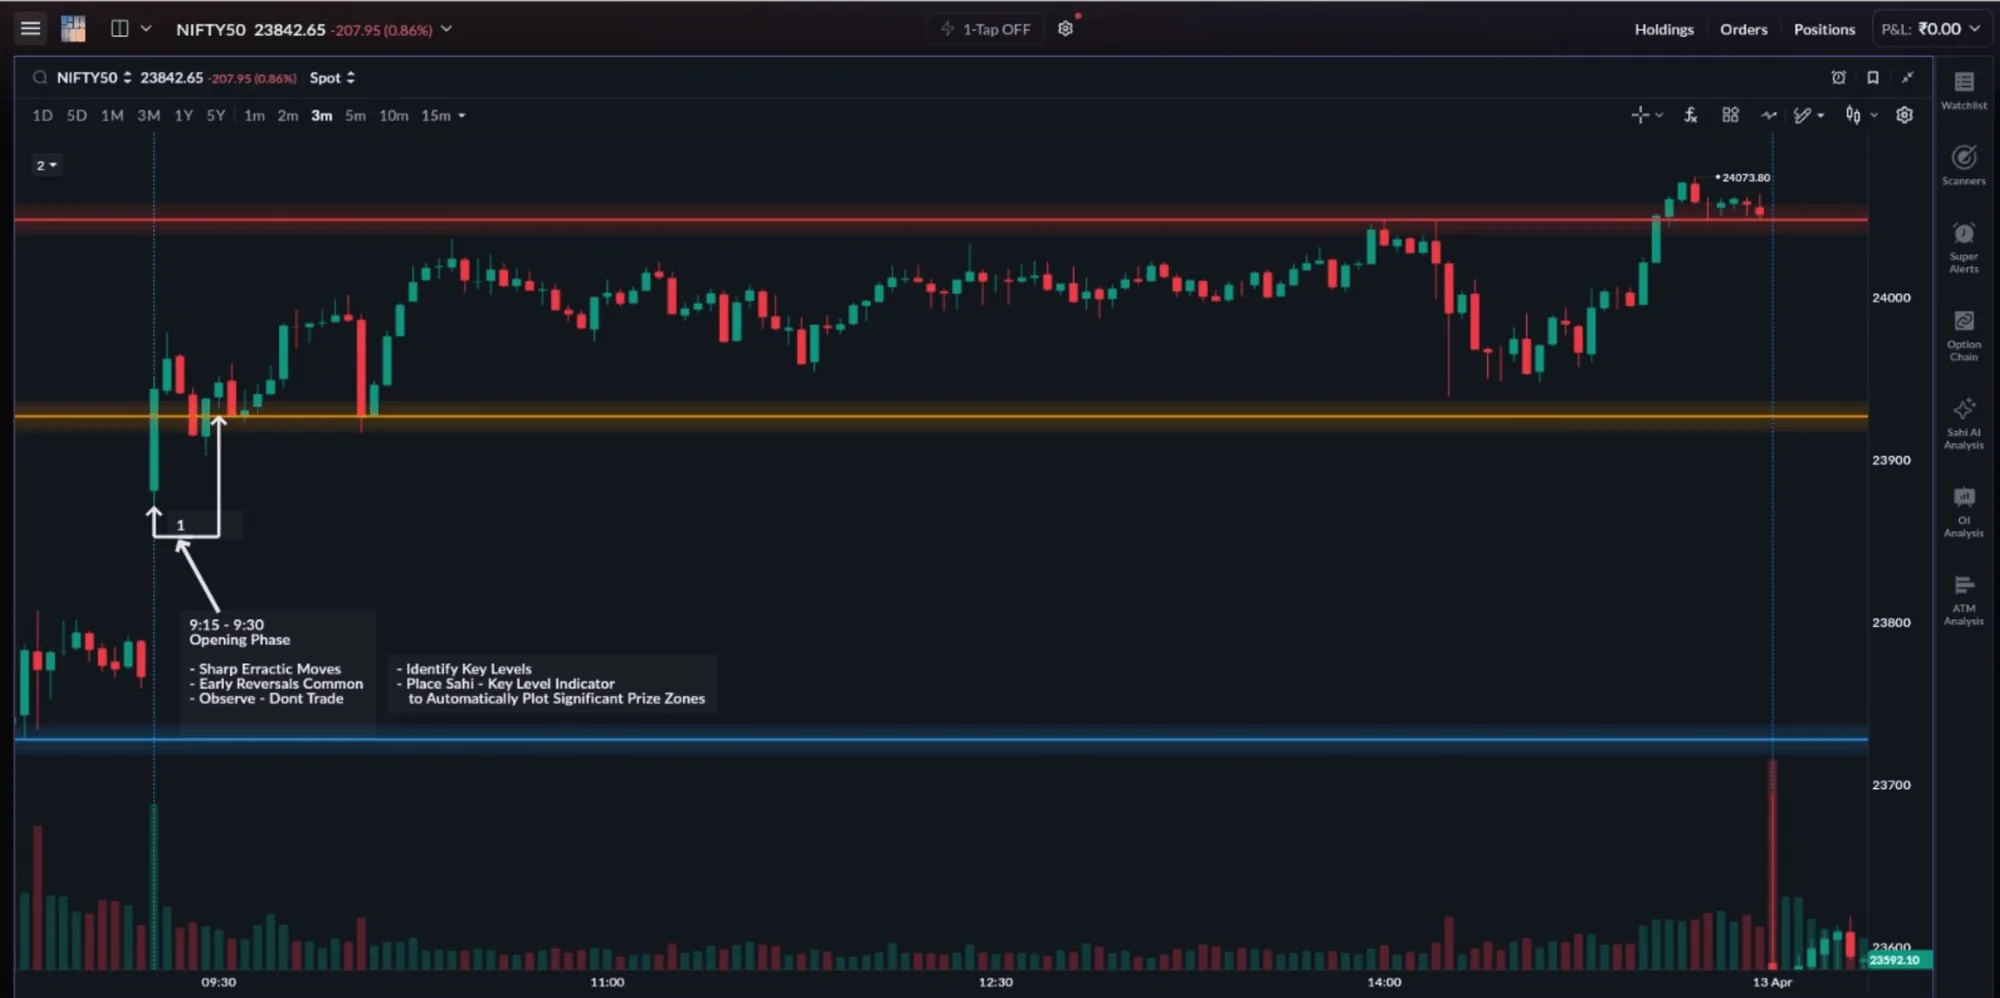
The first 15 minutes are not a trading window. Use them to see where price opens against the previous day's levels and whether the first move looks likely to continue or reverse. This is also the time to let SAHI's Key Level Indicator mark the important zones, so you enter Window 1 with a clear map.
Take the Nifty chart on 10 April 2026. The index opened with a gap up near 23,880, ran up sharply in the first candles, and fell back towards the 23,900 zone within minutes. Entering in that phase would have meant buying the spike or selling the dip, with no structure to place a stop against.
Window 1: 09:30 to 10:15
Once the opening volatility settles, price becomes far more structured. Levels begin to hold, spreads stay tight, and option premiums respond cleanly to moves in the index. The market has shown its first direction, so setups on the 1-minute and 5-minute charts are clearer and execution is more consistent. This is the first high-probability window of the day.
The dead zone: 11:30 to 13:30
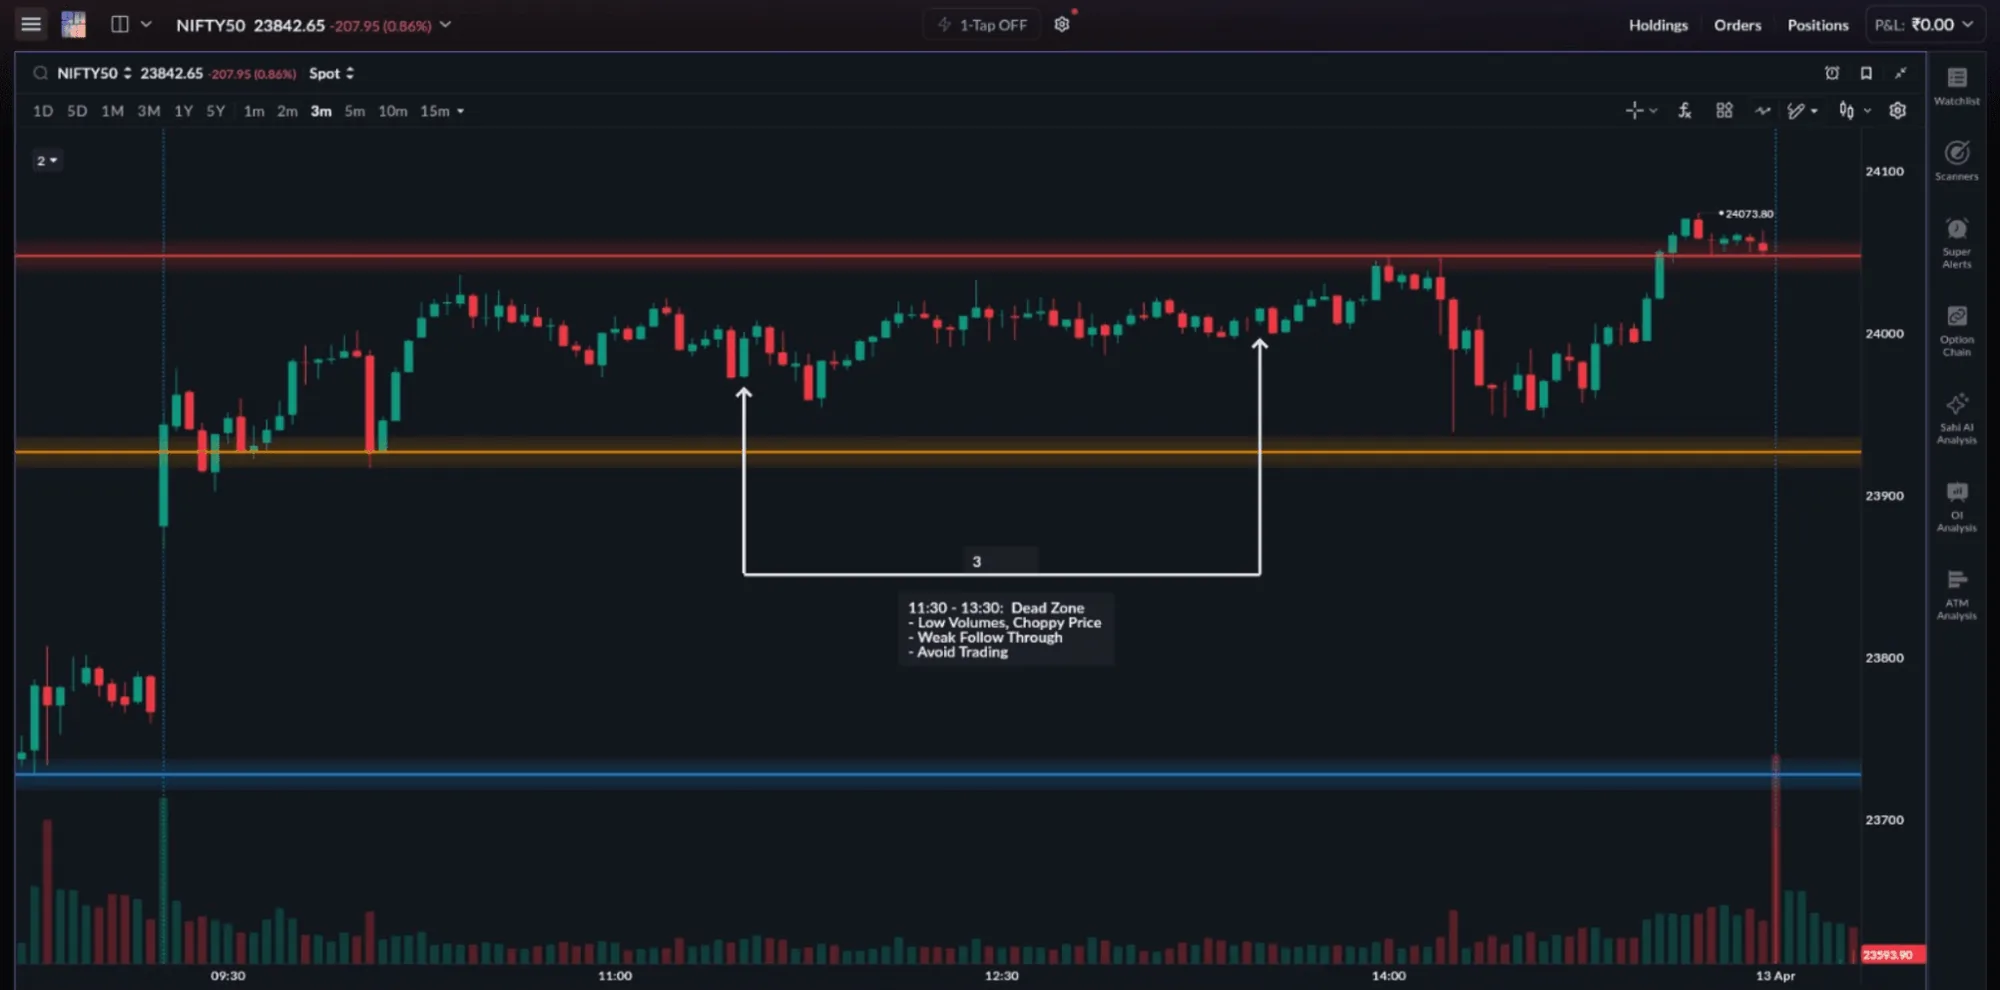
Midday is usually the least productive phase. Volume drops, spreads widen and price drifts without direction. Trades are possible, but for most scalpers the costs (charges, slippage and mental fatigue) outweigh what the period offers. Experienced traders often step away.
Window 2: 14:30 to 15:15
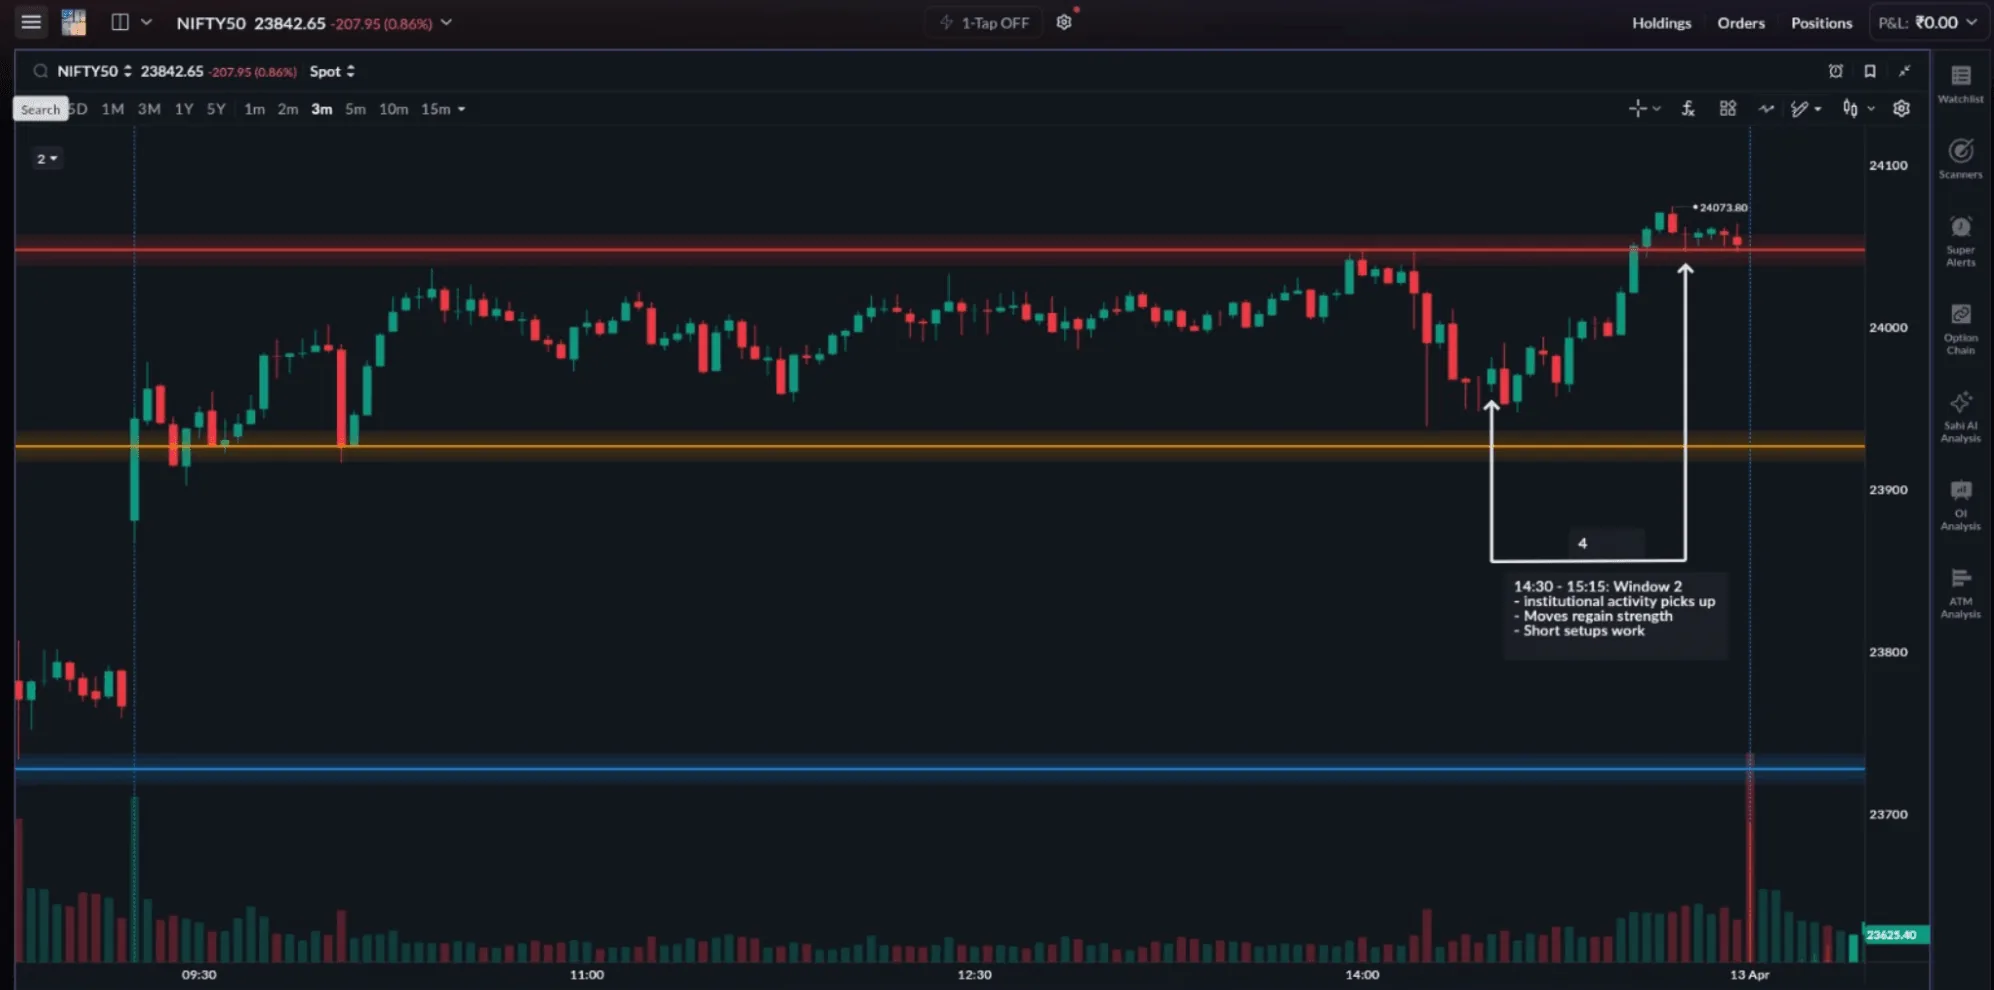
In the last hour, institutions adjust or close positions before the close. Volume and tight spreads return, and moves complete faster, which suits scalping. But options behave differently now. Time decay speeds up towards the close, especially on expiry days, so a premium can fall even when the index barely moves. Option buying carries more risk here; option selling can benefit from the faster decay.
Expiry days
Expiry days behave differently. Near expiry, at-the-money options are very sensitive to the index (high gamma, covered in Chapter 5), so premiums can jump on a move of a few points. Positions are also being closed through the day, so activity stays high outside the two usual windows. Treat expiry days as higher-opportunity, higher-risk days, and size positions down.
Two timeframes: structure and entry
Options scalpers in India usually read two charts of the same index together:
| Chart | Job | What you mark on it |
|---|---|---|
| 5-minute | Structure and bias | Trend, support and resistance zones, the pattern that is forming |
| 1-minute | Entry timing | The breakout or rejection candle, the volume spike, a tight stop |
Structure on the 5-minute chart, entry on the 1-minute chart. Most false-signal trades come from acting on a 1-minute signal with no 5-minute structure behind it.
What to trade
Scalping works best in highly liquid contracts, such as Nifty and Bank Nifty options. They have tight bid-ask spreads and steady order flow, so entries and exits are clean. Index options make up most of the derivatives trading on NSE, one of the largest derivatives exchanges in the world by number of contracts traded.
In illiquid options, spreads are wide and price moves in jumps. Even when the setup is right, slippage on entry and exit eats the small move a scalp aims for. That is why most scalping is built around index options rather than individual stock options. Check which index contracts currently have weekly expiries before you plan; the exchange calendar changes from time to time.
Reversal setups at a level
Do not try to memorise patterns. Learn to recognise what kind of setup is forming at a key level. Most intraday setups fall into two families: reversal and continuation.
A reversal setup forms when price reaches a significant level after an extended move and shows signs of turning. Common ones:
| Pattern | What you see | What it tells you |
|---|---|---|
| Engulfing | A candle whose body covers the whole body of the candle before it, in the opposite colour | Control flipped within one candle |
| Rejection candle | A long wick into the level and a close back away from it | The level was tested and defended |
| Morning or evening star | A strong candle, a small indecisive candle, then a strong candle the other way | Momentum stalled, then reversed |
| Double top or bottom | Two tests of the same level, then a break of the swing between them (the neckline) | The second attempt failed |
| Head and shoulders | Three peaks with the middle one highest, then a break of the neckline | The trend lost strength before turning |
Trade 1: bearish engulfing at a SAHI key level
On a 2-minute Nifty chart, SAHI's Key Level Indicator marked a resistance zone near 24,034. Nifty had been making higher highs and higher lows and reached the level with momentum. At 24,034 a bearish engulfing formed: the red candle closed at 24,034 with a low of 24,030.75.
| Parameter | Value |
|---|---|
| Pattern | Bearish engulfing |
| Key level (SAHI) | 24,034 |
| Entry | 24,030, just below the engulfing low |
| Stop-loss | 24,048, just above the engulfing high |
| Risk | 24,048 − 24,030 = 18 points |
| Target (1:4) | 24,030 − (4 × 18) = 23,958 |
| Exit | Near 23,960 |
The sample chart below redraws this structure on made-up 1-minute candles, using the same levels.
- Up
- Down
- Resistance 24,034
- The level is tested. A candle's high touches 24,034 and it closes 18 points lower. The level is now on your map.
- The engulfing candle. Eight candles later price closes above the level, and a small green candle follows, closing at 24,043. The next candle opens there and closes red at 24,034, below the green candle's open of 24,038: its body engulfs the green body. High 24,048, low 24,031.
- Volume confirms. The engulfing candle's volume bar is more than twice the average of the 10 bars before it.
- Entry and follow-through. The next candle breaks below 24,031, triggering the short at 24,030 with the stop at 24,048. Price never returns above 24,035 and reaches the 23,958 target nine candles later.
Without the level, the engulfing candle would have meant little. The level gave the pattern its meaning; the pattern only timed the entry.
Double bottom with a rejection wick
Chart structures follow the same logic over more candles. A double bottom is two failed attempts to break the same support.
- Up
- Down
- Support
- Neckline
- First low. Price falls to 23,962 on above-average volume, then bounces to 24,013. That bounce high is the neckline.
- Second low. Thirteen candles later price returns to 23,963, one point from the first low, after a drift lower on light volume. The low candle leaves a long lower wick and closes near its high: buyers absorbed the selling.
- Neckline break. Five candles later a candle closes at 24,022, above the neckline, on volume nearly three times the recent average. This is the confirmation: entry on the close or on a retest of the neckline, stop below the breakout candle or, more safely, below the second low.
Continuation setups
A continuation setup forms when price makes a sharp move, pauses, and then resumes in the same direction. The pause is a short consolidation before momentum continues. Common ones:
- Flag: a small channel that drifts slightly against the move.
- Pennant: a small triangle whose highs and lows converge.
- Triangles: ascending, descending and symmetrical.
- Rectangles: a flat range, followed by a breakout.
- Continuation candles at key levels, such as a strong close through the level after a short pause.
- Up
- Down
- Flag
- The pole. Five green candles lift price about 74 points, from 23,974 to 24,048, on volume about twice the earlier bars.
- The flag. For the next nine candles price drifts down to 24,026 on the lightest volume on the chart. It gives back only about a third of the pole: sellers are not pressing.
- Breakout. One candle closes at 24,055, above the flag top of 24,052, on the heaviest volume on the chart.
- Retest. Three to five candles after the breakout, price dips back to the flag top on light volume and holds. That is the lower-risk entry, with the stop just below the retest low. Price reaches about 24,100 some 14 candles later.
Trade 2: pennant breakout with OI support
SAHI's OI Support tool marked 24,000 as strong support, showing heavy put writing at that strike. The Key Level Indicator also marked 24,000. After a sharp move up from below 24,000, Nifty formed a pennant just above the level for about 15 one-minute candles, then broke out above it.
| Parameter | Value |
|---|---|
| Pattern | Pennant breakout |
| OI support and key level (SAHI) | 24,000 |
| Entry | 24,010, above the breakout candle's high |
| Stop-loss | 23,992, below the pennant low |
| Risk | 24,010 − 23,992 = 18 points |
| Target (1:2.5) | 24,010 + (2.5 × 18) = 24,055 |
| Exit | Near 24,070: price ran past the target, about 60 points or a little over 3 times the risk |
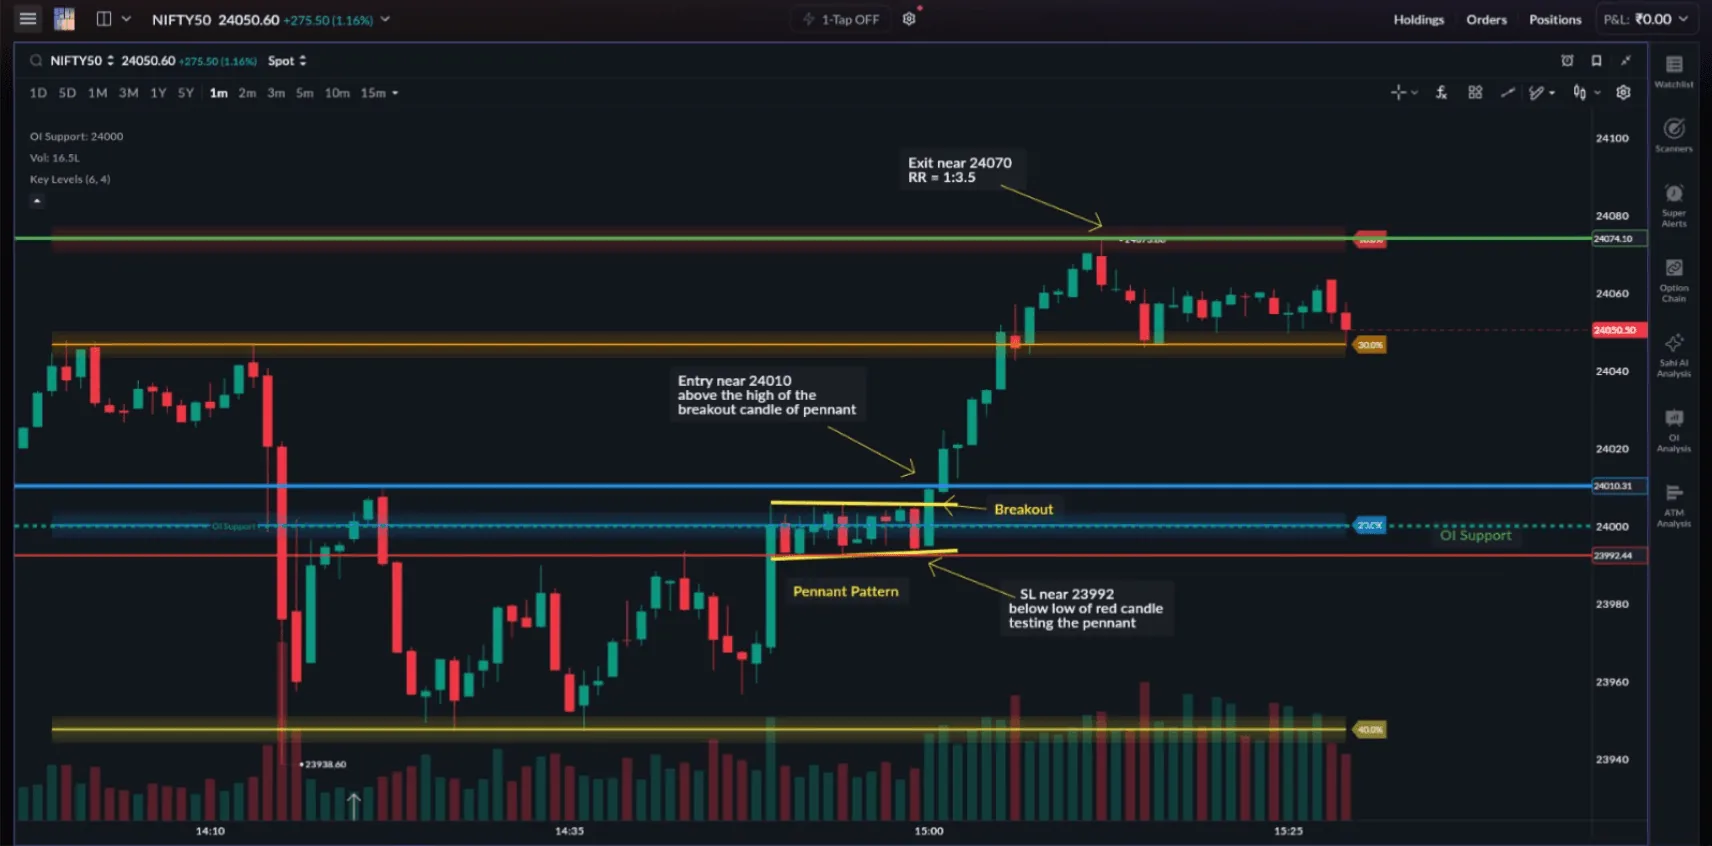
The strength of this setup was alignment: the OI data and the key level pointed to the same zone, and the pattern formed right on it.
Where these setups fail
These setups work under the right conditions. Know where they break down:
- OI levels can shift quickly. Large positions are unwound within minutes, especially near expiry. A strike that showed strong put writing at 09:30 can look very different by 11:00. Always keep a stop, however strong the OI picture looks.
- Patterns fail without volume. A bearish engulfing on low volume at a key level is weaker than the same candle with a volume spike. Check the volume bar under every breakout or reversal candle; if it is flat or falling, trust the pattern less.
- The dead zone produces false setups. Between 11:30 and 13:30, price draws shapes that look valid but have no follow-through. The time window matters as much as the pattern.
- Time decay changes the maths for option buyers on expiry days. In a flat market, an at-the-money premium can lose value quickly within the hour. A trade that is right on direction can still lose if held too long. Where possible, keep expiry-day scalps within about 15 one-minute candles.
- Costs add up on repeated entries. As Chapter 3 showed, one round trip of 1 lot can cost about ₹30 in charges. Enter only when the setup meets every condition.
The goal is not more trades. It is better trades, where time, level, pattern and volume all agree.
Checklist
- Observe from 09:15 to 09:30; mark the levels and let the open settle.
- Trade mainly 09:30 to 10:15 and 14:30 to 15:15; step away from 11:30 to 13:30.
- Build structure and bias on the 5-minute chart; time the entry on the 1-minute chart.
- Trade liquid index options, where spreads are tight and fills are clean.
- Take a pattern only at a key level, with a volume spike behind the signal candle.
- Prefer the retest after a breakout, and keep a stop however strong the OI looks.
Questions
Why should I not trade between 09:15 and 09:30?
Price is erratic and often reverses quickly. There is movement, but no structure to place a stop against. Use the time to mark levels.
Can I take trades only on the 1-minute chart?
No. The 1-minute chart is for timing. The setup comes from the 5-minute structure.
What if a pattern forms but not at a key level?
Ignore it. Without a level, the pattern has low reliability.
Which matters more: the pattern or the level?
The level. The pattern only helps you time the entry.
What if a breakout happens but price does not follow through?
Exit early. If the next few candles cannot hold beyond the level, the setup has not worked.
What if Key Level and OI show a level but there is no pattern?
Do not enter. A level without a confirming candle is a zone to watch, not a trade.
Scalping knowledge check
Do you know when and what to scalp?
Five quick questions on trading windows, timeframes, candlestick patterns and OI levels. Under 5 minutes
-
Show answer
Answer: B. 09:30 – 10:15. After the erratic opening phase, this window offers high volume, directional moves and clean setups: the first high-probability window of the day.
-
Show answer
Answer: C. Observe only. The first 15 minutes bring gaps, spikes and quick reversals. Watch the open, let SAHI's Key Level Indicator mark the zones, and enter the next window with structure in mind.
-
Show answer
Answer: A. Structure on the 5-minute chart, entry on the 1-minute chart. Most false signals come from 1-minute entries taken without the 5-minute context.
-
Show answer
Answer: D. A pattern at a key level, confirmed by volume, is a setup. The same pattern away from any meaningful level is just price movement.
-
Show answer
Answer: B. Support. Heavy put writing marks strikes where large participants expect price to hold, as with the 24,000 OI support in Trade 2. The highest call OI strikes tend to act as resistance.
You got 0 of 5 right.