


Where to find them
WhereAny chartIndicatorsAI based
All 17 sit in the AI based tab of the indicator list, next to Key Levels, and join a library of 100+ indicators including Expected Move and OI Profile. No subscription, no add-on.
They fall into four jobs, below: trend lines that adapt, buy and sell signals, momentum oscillators, and bands, levels and targets. Ten of them have a full guide on this site.
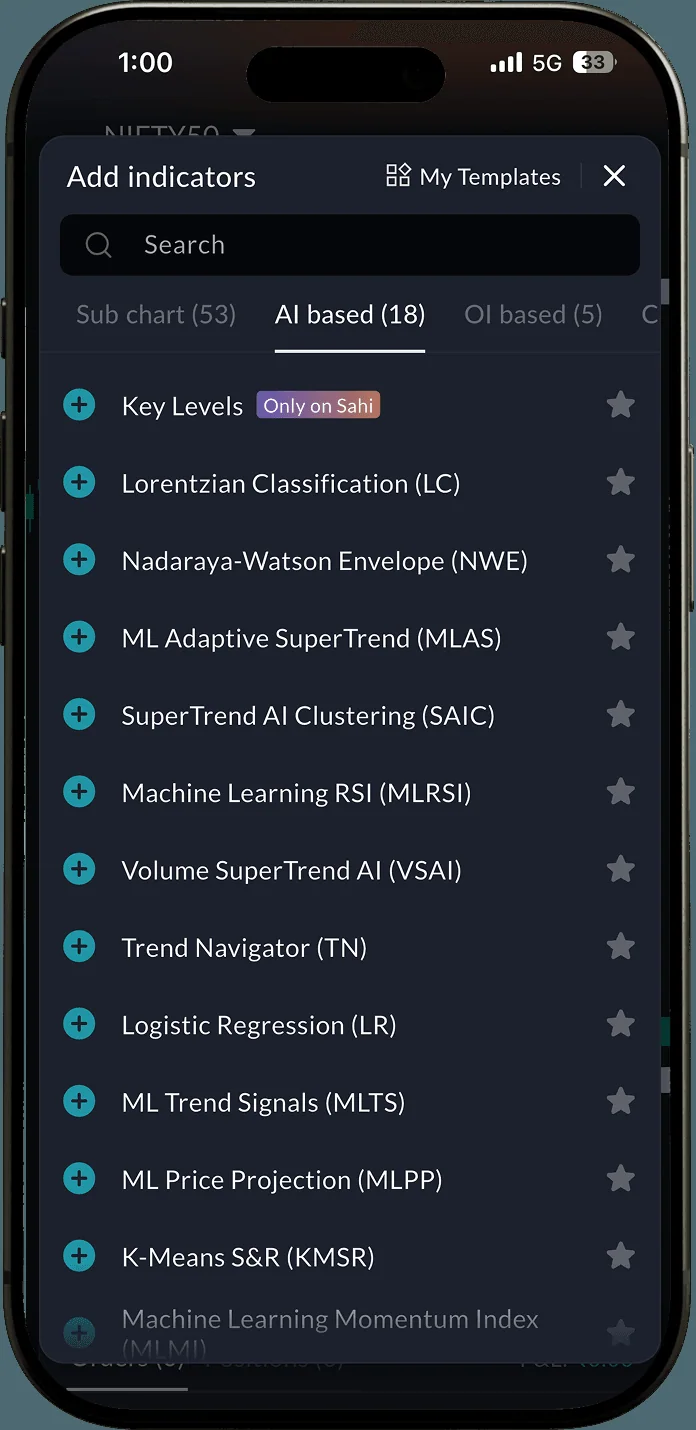 The AI based tab: Key Levels plus the 17
How to use it3 steps
- Open any chart and tap Indicators.
- Open the AI based tab.
- Tap an indicator to add it. Its settings are in the chart legend.
- Some indicators show a stats box with hit rate or accuracy: that is how past signals did on that chart, not a promise about the next one.
- These are analysis tools, not trading advice.
Trend lines that adapt
WhereIndicatorsAI based
SuperTrend-style lines that tune themselves to volatility, volume or past performance instead of using one fixed setting.

ML Adaptive SuperTrend
Sorts recent ATR into High, Medium and Low volatility clusters (k-means) and runs SuperTrend with the cluster that matches the current bar, so the band tightens in calm markets and widens in spikes.
On the chartOne SuperTrend line with a gradient fill, a labelled arrow at each flip, and a table of the three clusters.
Best forTrend followers tired of false SuperTrend flips when volatility changes mid-session.

SuperTrend AI Clustering
Runs many SuperTrends with different ATR multipliers, groups them into Best, Average and Worst performers, and drives the trailing stop with the factor from the cluster you pick.
On the chartA teal/red trailing stop, a smoother trailing-stop AMA, and a table of cluster sizes and factors.
Best forSuperTrend users who spend time hand-tuning the ATR factor.
Full guide to SAIC
Volume SuperTrend AI
Builds SuperTrend bands on a volume-weighted average, so heavy-volume bars move them more, then classifies each bar bullish, bearish or neutral with k-nearest neighbours.
On the chartOne trend line coloured lime, red or blue, a gradient cloud, dots at new trends and triangles at confirmed crossovers.
Best forTraders who want volume behind a trend change before they act.
Full guide to VSAI
Trend Navigator
A k-nearest-neighbours classifier votes on whether the trend is up or down by comparing recent smoothed prices with history.
On the chartA KNN line coloured lime (up), red (down) or orange (flat), and a slower teal average line as the baseline.
Best forA clean trend read without oscillators cluttering the chart.
Full guide to TN
ML Moving Average
Labels each bar bullish or bearish with a weighted kNN, fits a live regression slope to the run since the last flip, and averages the nearest historical prices for a noise-filtered curve.
On the chartA moving average coloured green, red or blue, a slope line, and two more curves at different smoothing.
Best forTraders who use a moving average as their main trend filter.
Buy and sell signals
WhereIndicatorsAI based
Models that classify each bar and mark when the read flips, some with stats on how past signals went.
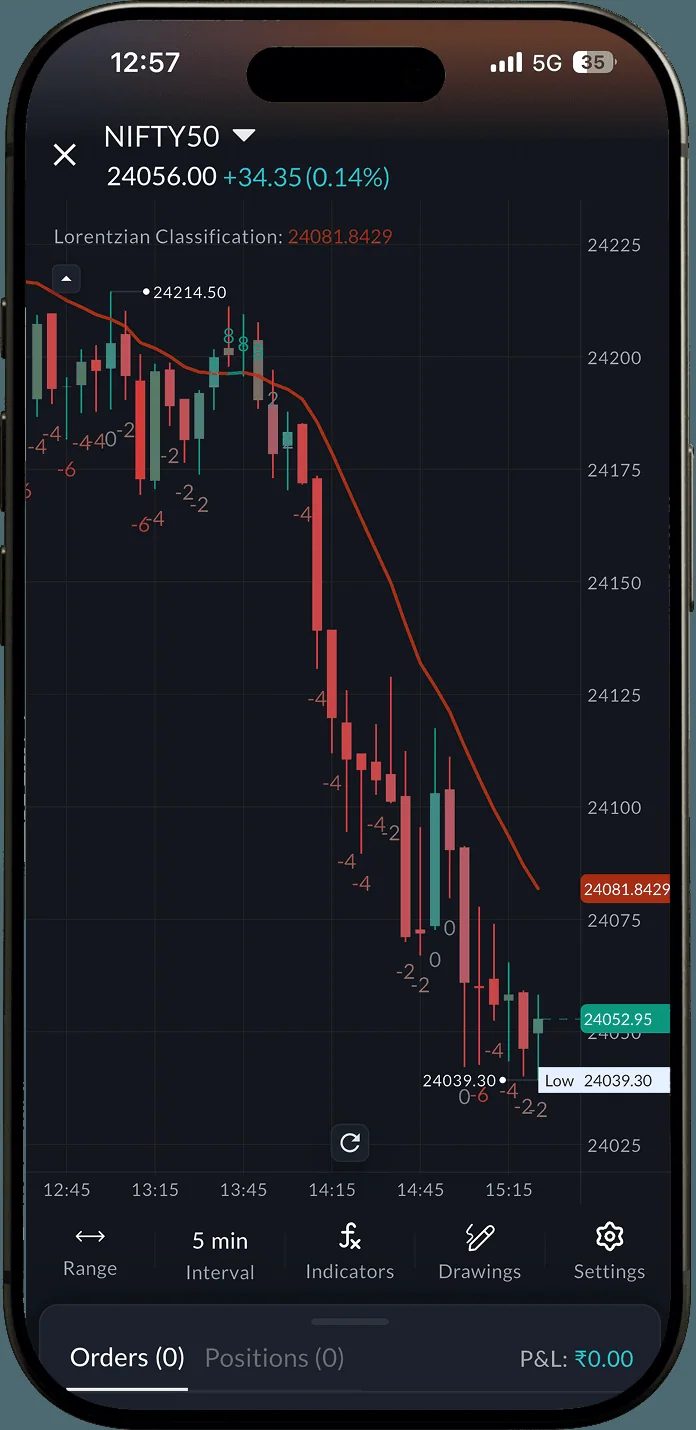
Lorentzian Classification
Scans thousands of past bars for market states most like the current one (k-nearest neighbours with a Lorentzian distance) and signals the direction that followed them.
On the chartA smoothed kernel regression curve, bars coloured by the prediction, confidence scores, and a Trade Stats box with hit rate and trade count.
Best forIntraday F&O on 5-minute NIFTY and BANKNIFTY charts.
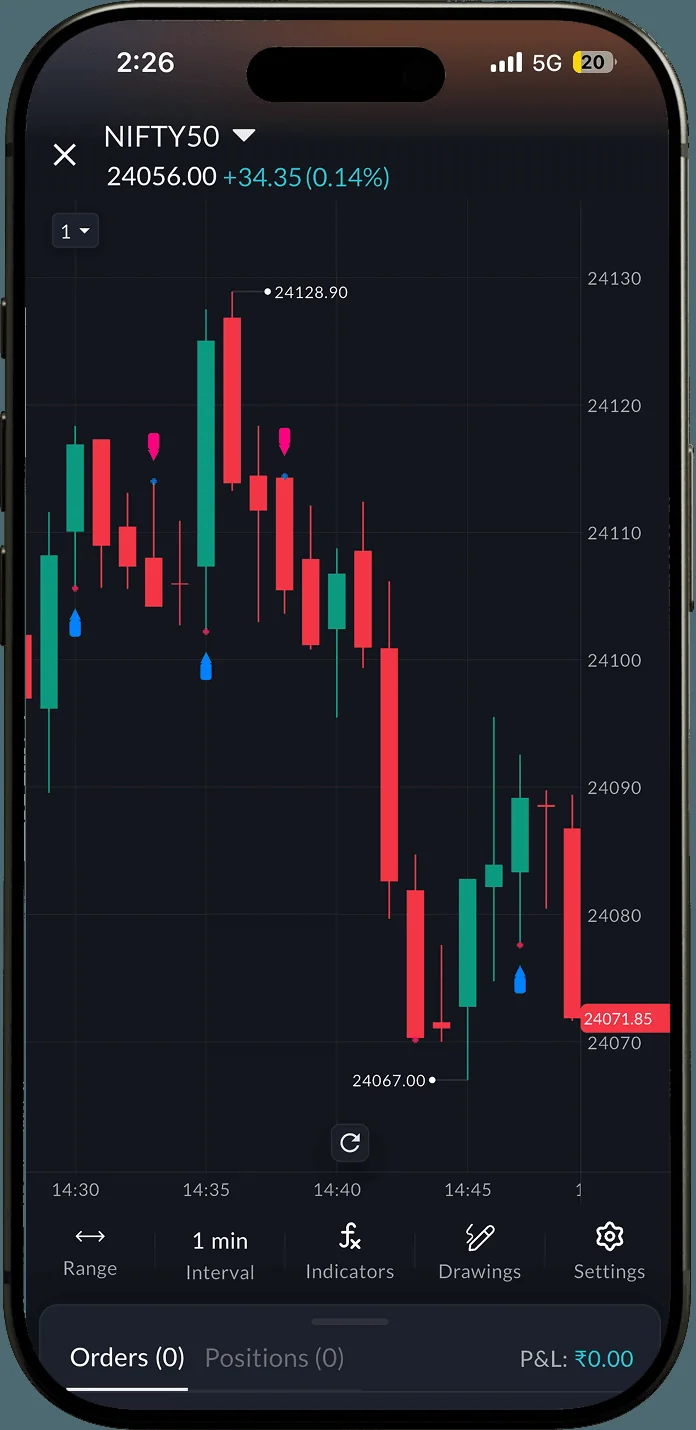
Logistic Regression
Trains a logistic model on price bar by bar and flips between bullish and bearish only when the probability crosses a threshold.
On the chartAqua up-arrows and pink down-arrows, a cross at each exit, and optional curves and a stats label.
Best forTraders who want a signal from a well-understood statistical model.
Full guide to LR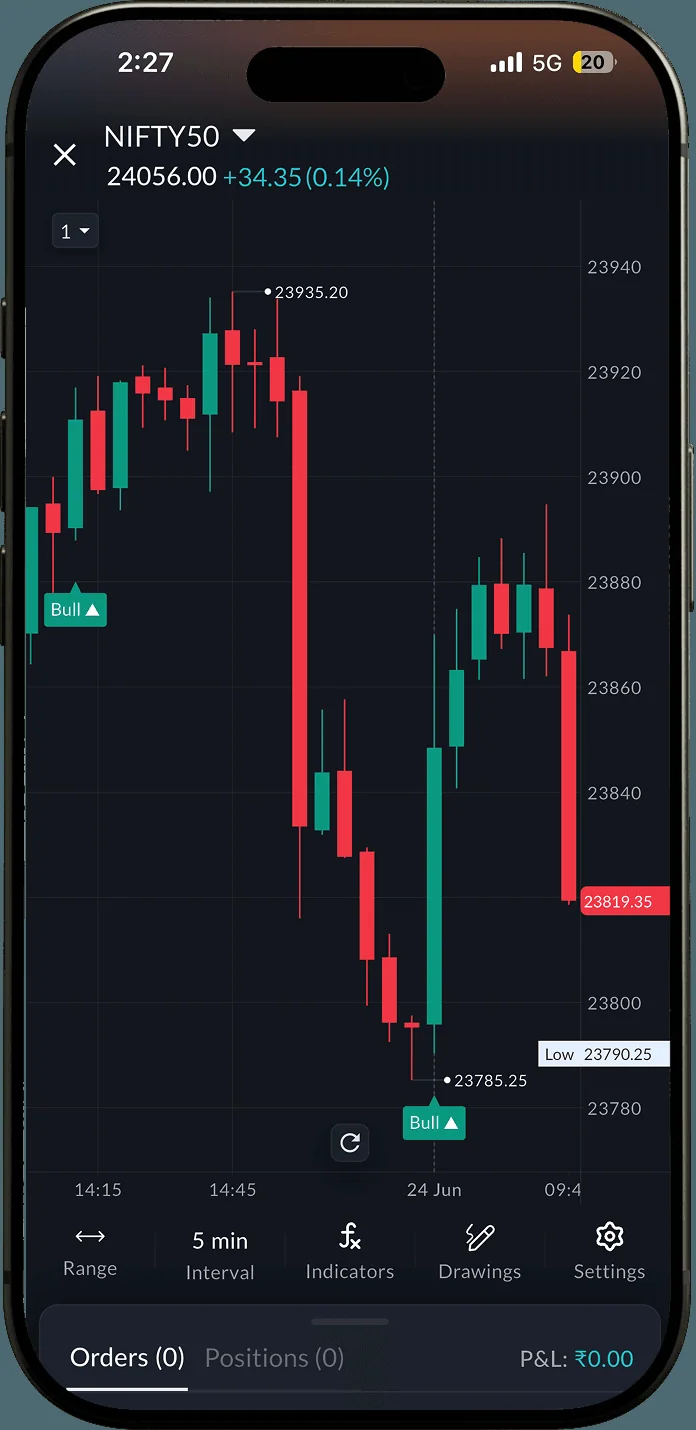
ML Trend Signals
A SuperTrend engine that keeps testing long and short positions in the background and adjusts its own sensitivity to the market.
On the chartOnly a teal Bull label below or a red Bear label above a candle. No lines or bands.
Best forTraders who want a signal with no visual noise.
Full guide to MLTS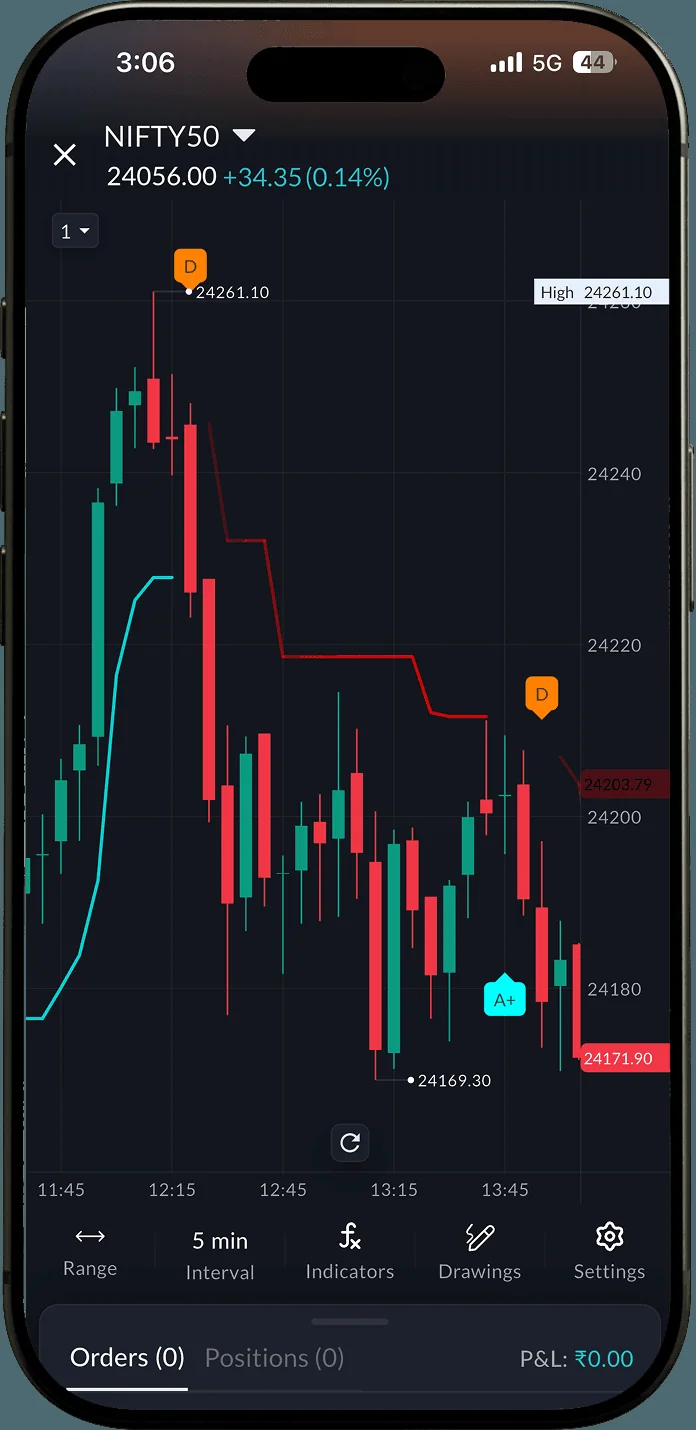
Neural Network Bull and Bear Signals
Scores each momentum flip with a small neural network over five inputs (momentum, two moving-average relations, nearby pivots, swing structure, ADX regime) and grades it A+ to F.
On the chartGrade labels at qualifying bars and a trailing SuperTrend stop after each signal.
Best forTraders who want only graded entries, with a stop already drawn.
Momentum oscillators
WhereIndicatorsAI based
RSI and momentum readings that learn from past states instead of using a fixed formula. Most draw in their own pane under the price.
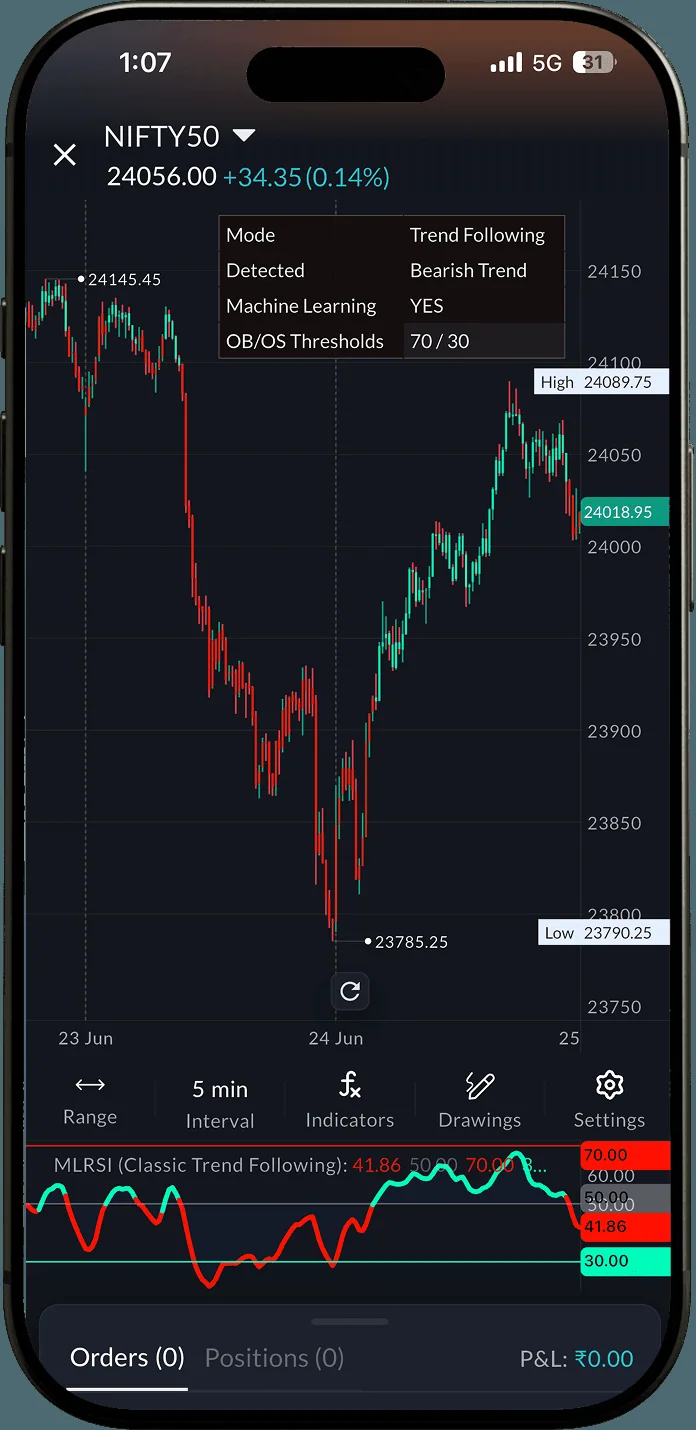
Machine Learning RSI
Blends a standard RSI with a k-nearest-neighbours prediction from similar past RSI states, then smooths it, so it reacts less to noise.
On the chartOne coloured line in its own pane with a 50 line, overbought and oversold zones, a status table, and coloured price bars.
Best forRSI users who see too many false extremes in trending markets.
Full guide to MLRSI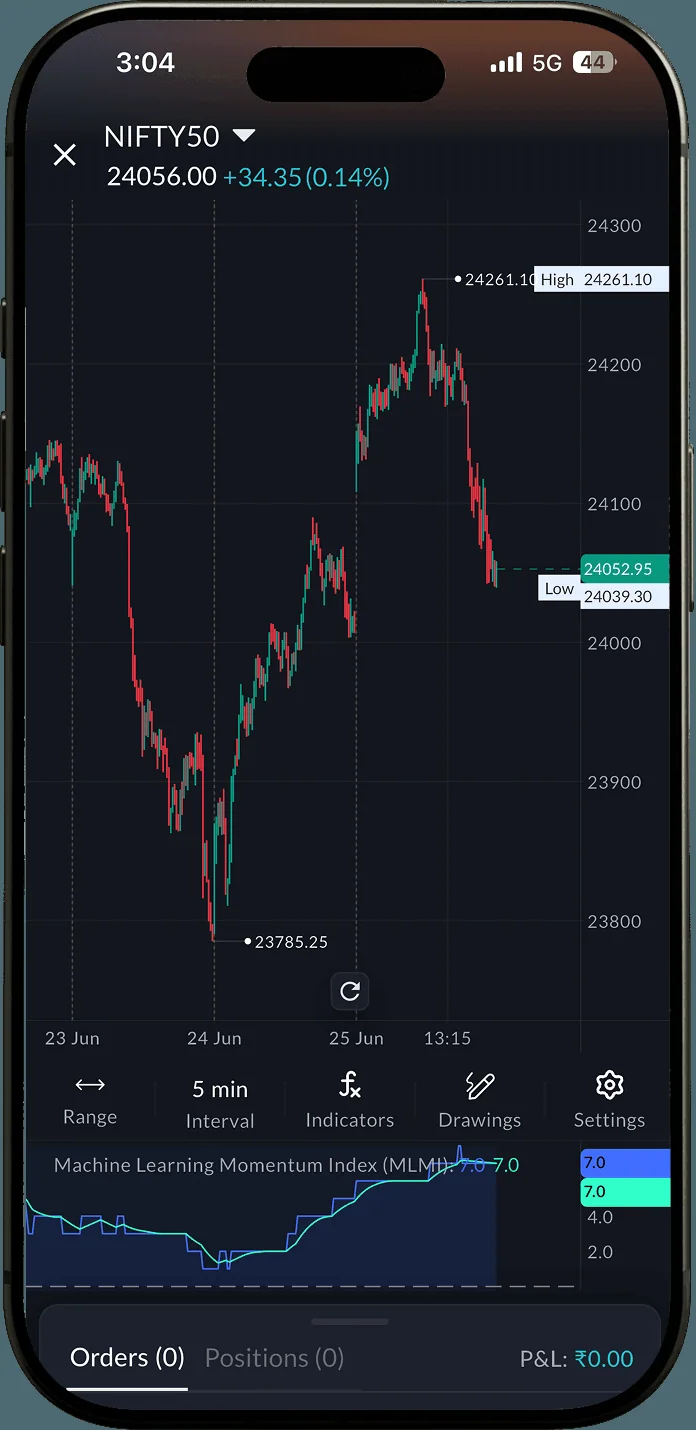
Machine Learning Momentum Index
Describes each bar by a fast and a slow smoothed RSI, finds the most similar past states and sums what followed them.
On the chartA blue prediction line and a teal signal line around zero, with green above and red below.
Best forTraders who filter trades with a momentum oscillator.

Machine Learning Momentum Oscillator
Computes a fast and a slow momentum signal and lets the most similar past bars vote on a single prediction.
On the chartCandles built from the prediction and a smoothed version, on a red-to-blue gradient background.
Best forAn oscillator that adjusts itself to the market's noise.
Full guide to MLMO
Kernel Momentum
Filters price with a Rational Quadratic kernel into an inner and an outer band, and flags momentum shifts where a faster Gaussian kernel crosses it.
On the chartSix band lines, a mid line, a fill, and crosses for four momentum conditions.
Best forA smoother alternative to moving-average crossovers.
Bands, levels and targets
WhereIndicatorsAI based
Envelopes around price, support and resistance found by clustering, structure filtered by machine learning, and data-based targets.
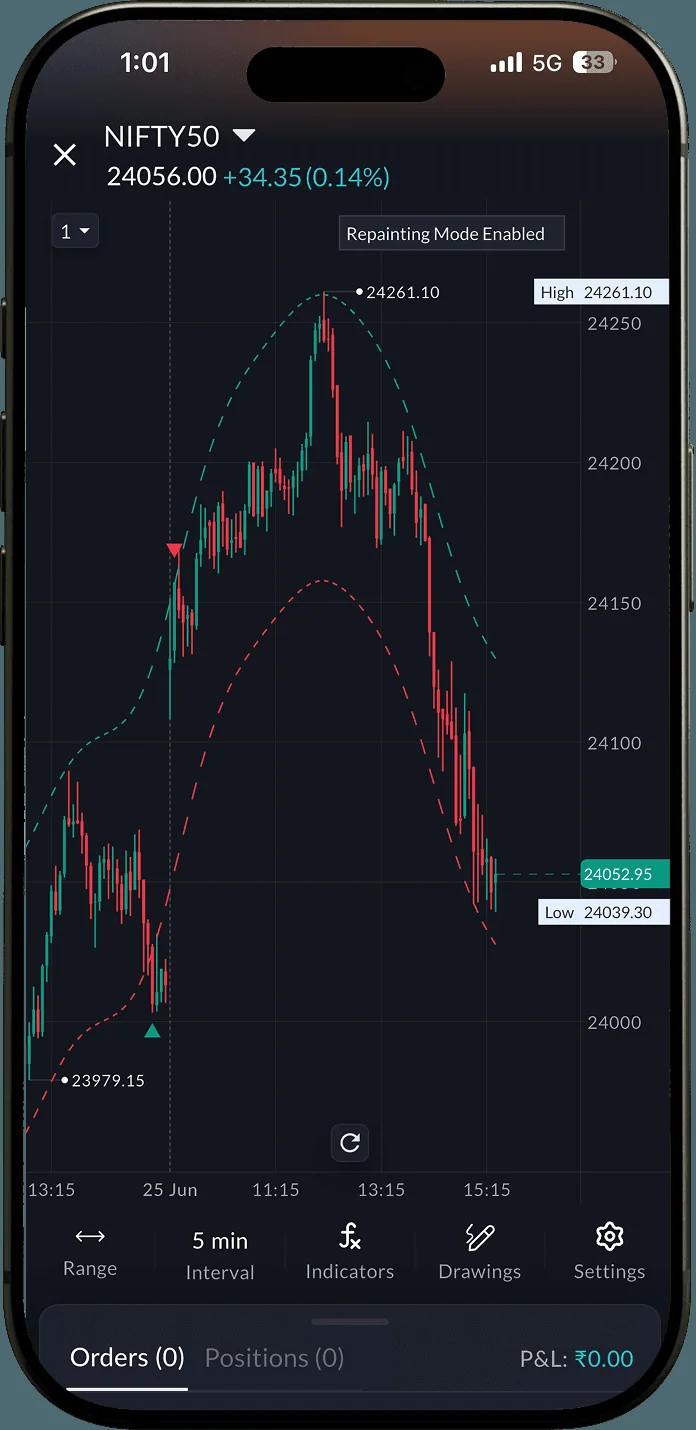
Nadaraya-Watson Envelope
Fits a smooth Gaussian-kernel curve through price and builds bands from how far price usually strays from it.
On the chartA teal upper and a red lower band, with an arrow when price breaks out and comes back inside.
Best forMean-reversion trades after an overextended move.
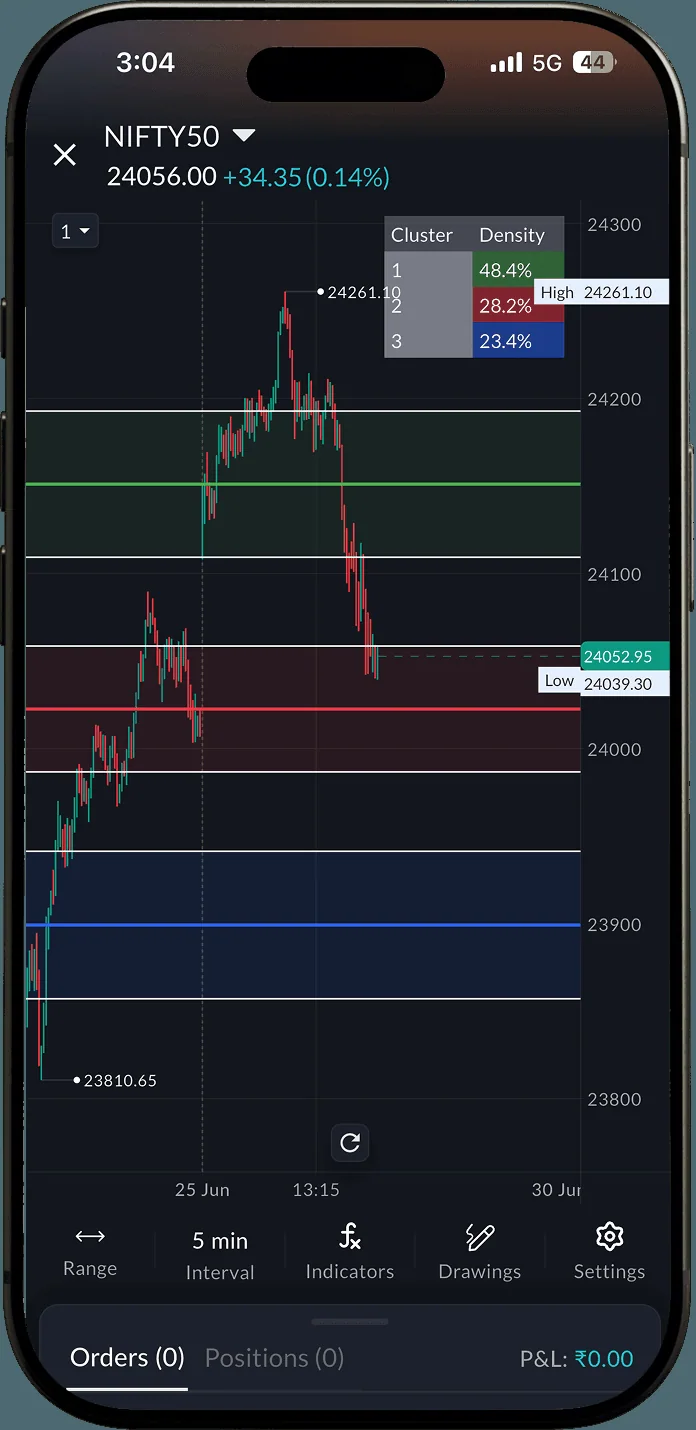
K-Means Support & Resistance
Groups recent closing prices into clusters (k-means) and draws each cluster's centre as a level.
On the chartThree to five coloured lines, optional bands around them, and a table of cluster density.
Best forObjective support and resistance instead of hand-drawn zones.
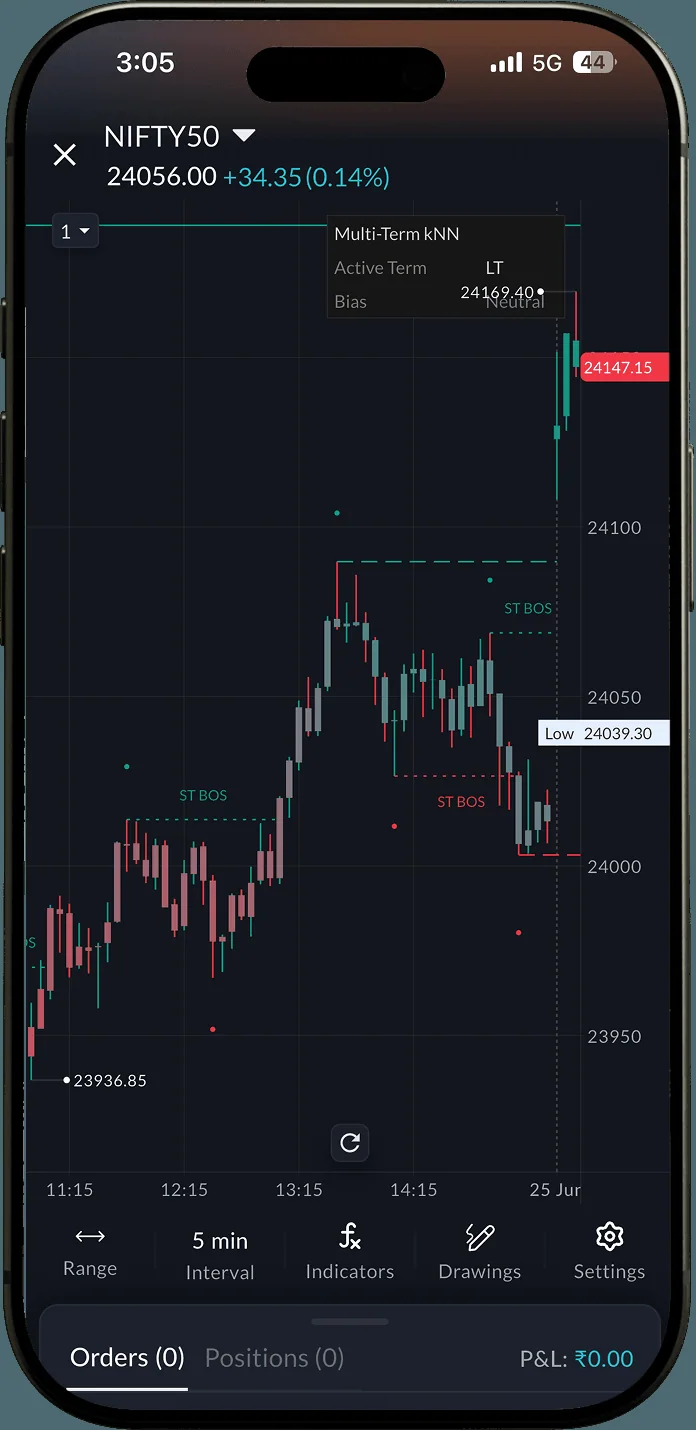
kNN Market Architecture
Finds swing highs and lows on three timeframe tiers and keeps a pivot only if a kNN check on its ATR and volume passes.
On the chartDotted, dashed and solid level lines (green highs, red lows), candles shaded by position in the range, and a Delta Tank label.
Best forSMC and ICT traders who want low-quality pivots filtered out.

ML Price Projection
When a trend flips, finds similar past setups across eight features (volatility, volume, RSI, choppiness and more) and projects how far price moved after them.
On the chartTake-profit and stop-loss boxes at the projected distance, and a table with training size, predicted move and reward-to-risk.
Best forTargets and stops from data instead of guesswork.
Questions
Are they really free?
Yes. All 17 are free on SAHI charts, with no subscription.
Where are they?
Open any chart, tap Indicators and go to the AI based tab.
Do the stats boxes predict future results?
No. Hit rates and accuracy describe how past signals did on that chart. Treat every signal as one input.
Open the AI based tabOpen any chart, tap Indicators and add one of the 17. Indicators are analysis tools, not buy or sell recommendations.
Open SAHI