


This is SAHI's engineering story, retold for traders. Each part says where you meet it on SAHI web, what it is, and what it does for you. The numbers are the ones SAHI's engineers report; we did not measure them. The screens are SAHI web on Sunday 25 October 2026, light and dark, so the prices are from Friday's close and no live ticks are moving.
The pipeline: exchange to screen
1Where it is
WhereBehind every SAHI chartWatchlistOption chain
You do not open it: it runs behind every price on SAHI, on the web terminal and the app. Every chart, watchlist row and option chain price arrives through it.
2What it is
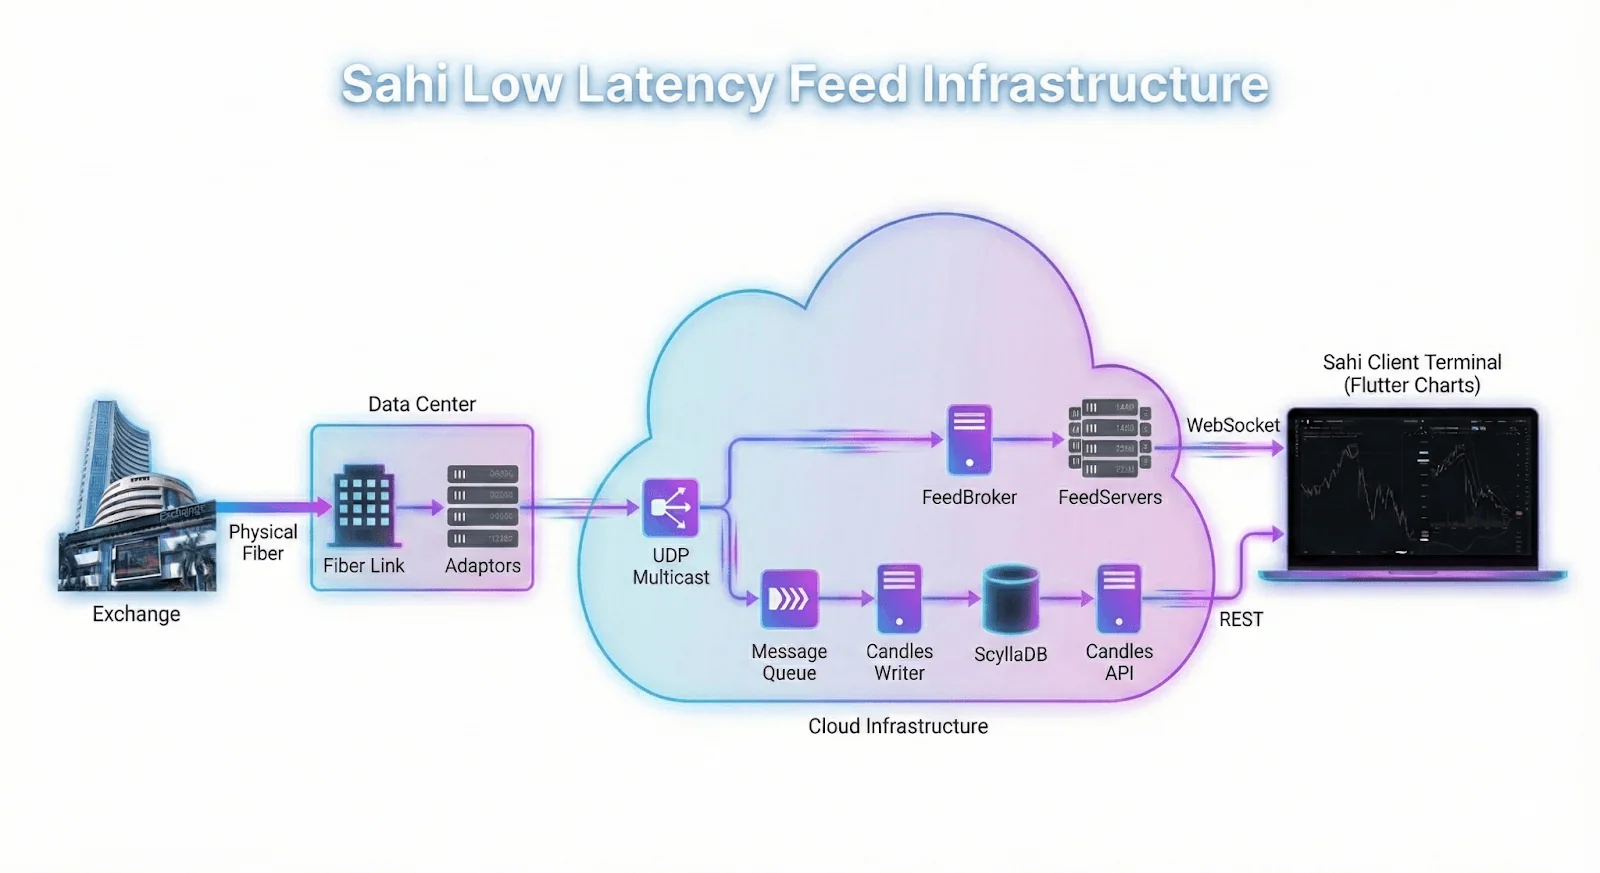
Prices reach SAHI's data centre over a dedicated fibre link from the exchange. Adaptors turn NSE's and BSE's different formats into one, so nothing later has to. From there the data is broadcast inside SAHI's cloud and splits in two.
The fast path carries live ticks: FeedBroker keeps the latest price of every instrument and passes ticks to the FeedServers, which hold the connection to your screen. The durable path builds history: ticks go through a queue to the Candles Writer, which makes 5-second, 1-minute and 1-hour candles and stores them in ScyllaDB, a fast database; the Candles API serves them back. Both paths end in Sahi Charts.
- BAdaptors
Turn every exchange's format into one, once, at the edge.
- DFast path
FeedBroker and FeedServers: live ticks to your screen over a WebSocket.
- FYour terminal
Sahi Charts, which take both: history when you open a chart, ticks as they happen.
- AExchange and fibre
Prices leave NSE or BSE over a dedicated fibre link.
- CMulticast
One broadcast inside SAHI's cloud; here the data splits in two.
- EDurable path
Queue, Candles Writer, ScyllaDB and Candles API: the chart's history.
3How it helps
- Fewer hand-offs, less delay. Each part was built for this job, so no generic layer sits in the way adding its own lag.
- History and live prices do not compete. Loading a year of candles uses a different path from the ticks moving your chart.
Chart history in milliseconds
1Where it is
WhereSAHI webAny chart1D to 5YInterval
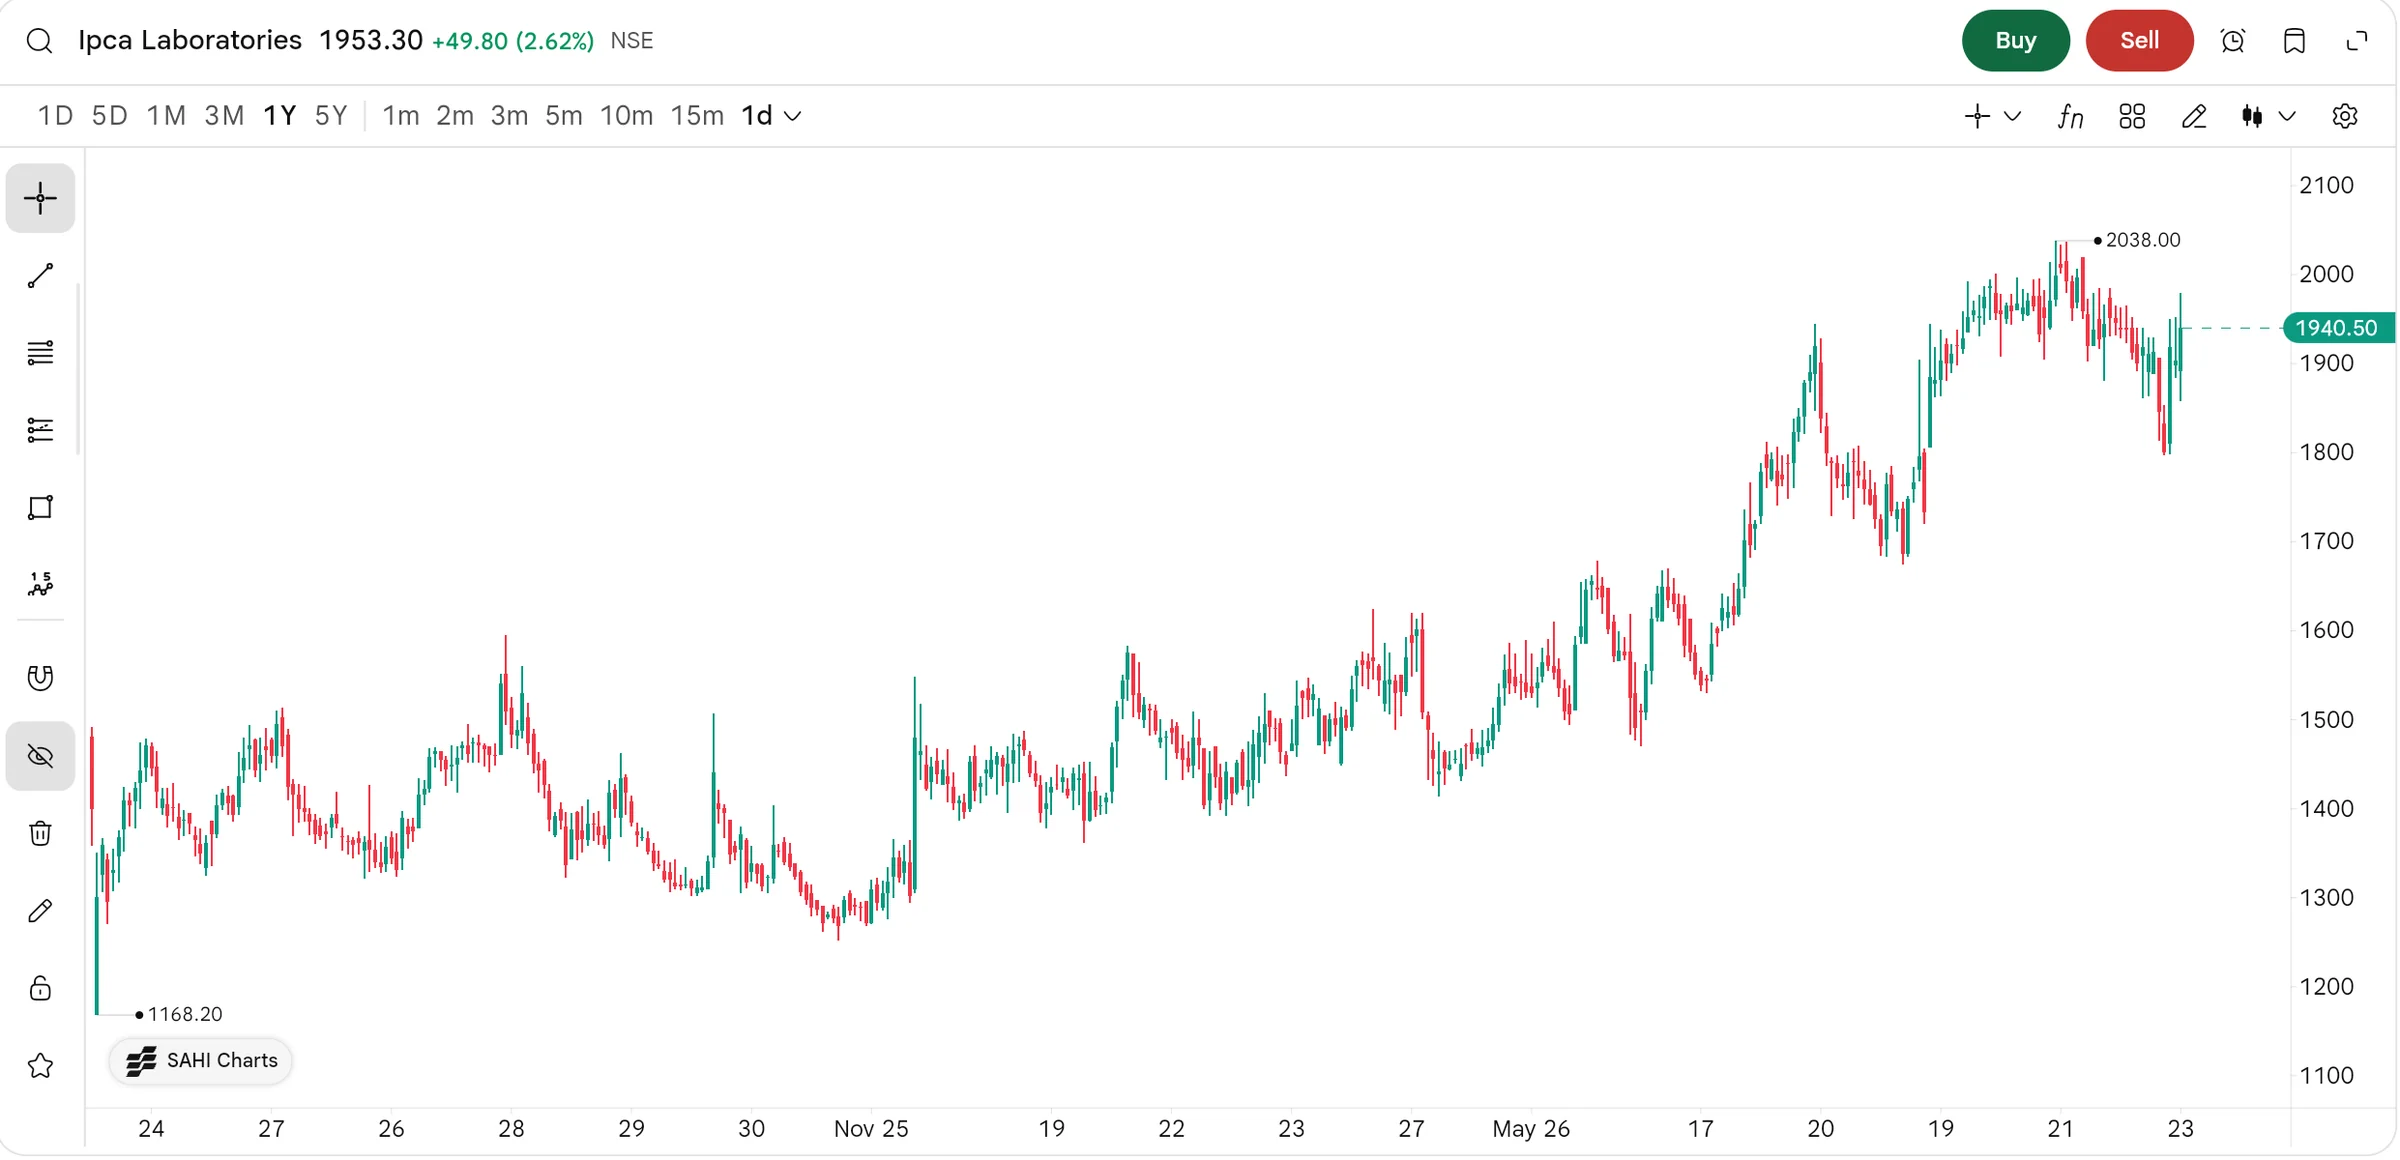
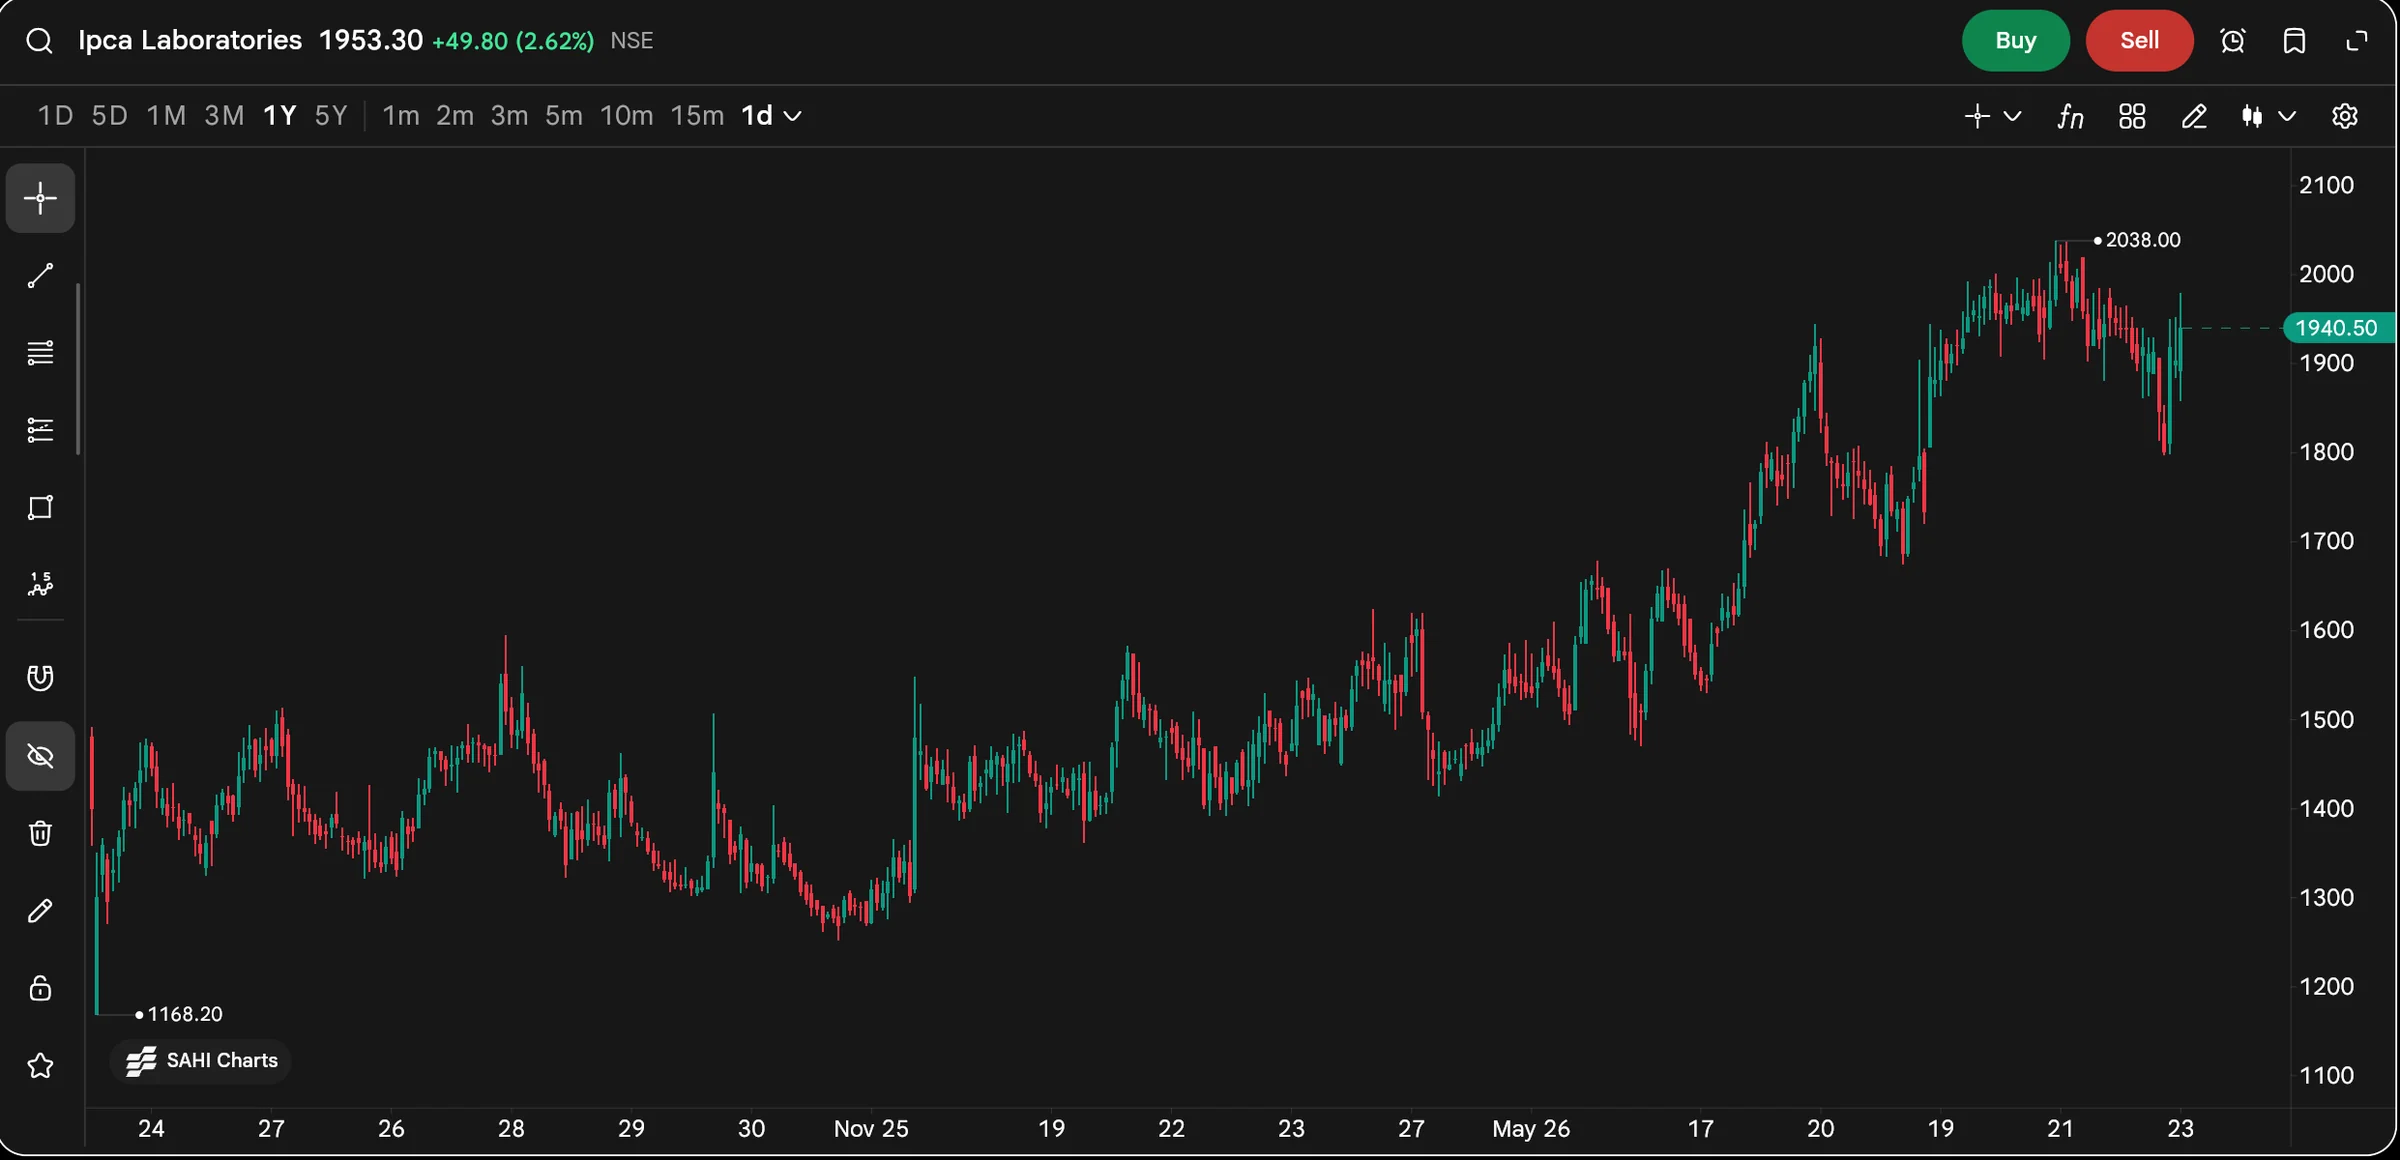
Every time you open a chart, press a range such as 1Y or 5Y, change the interval, or scroll back in time, the chart asks the Candles API for history.
2What it is
Candles are stored in ScyllaDB. SAHI's first design kept all of an instrument's candles for an interval together, and for busy names like NIFTY, Bank NIFTY and Reliance those blocks grew so large that the slowest loads took 300 milliseconds.
The fix was to split each instrument's history into time buckets, sized for each interval, and to send each query straight to the server and processor core that hold the data. SAHI reports about 10 ms to fetch 1,000 candles for 99 in 100 requests, under 20 ms for 999 in 1,000, and under 25 ms for 9,999 in 10,000.
- ARange
1D to 5Y: how much history to load.
- BInterval
1m to 1d: the size of each candle.
- DHigh and low
2038.00 and 1168.20, the extremes of the loaded range.
- CA year of candles
Each one comes from the Candles API, fetched in milliseconds.
- ELast price
Where the newest candle is; live ticks move it during market hours.
3How it helps
- Switch without waiting. Going from 5m to 1d, or from 1M to 5Y, redraws as fast as you can press.
- Scroll back freely. Older candles arrive as you pan, so looking for last year's level does not stall the chart.
SAHI's own challenge: open any stock and scroll back through a year of candles. On the chart above, 1Y on the daily interval is roughly 250 candles, a quarter of a 1,000-candle request.
- These are SAHI's reported server timings. What you see also depends on your connection and device.
Live prices to thousands of screens at once
1Where it is
WhereSAHI webEvery chart, watchlist and chainLive price
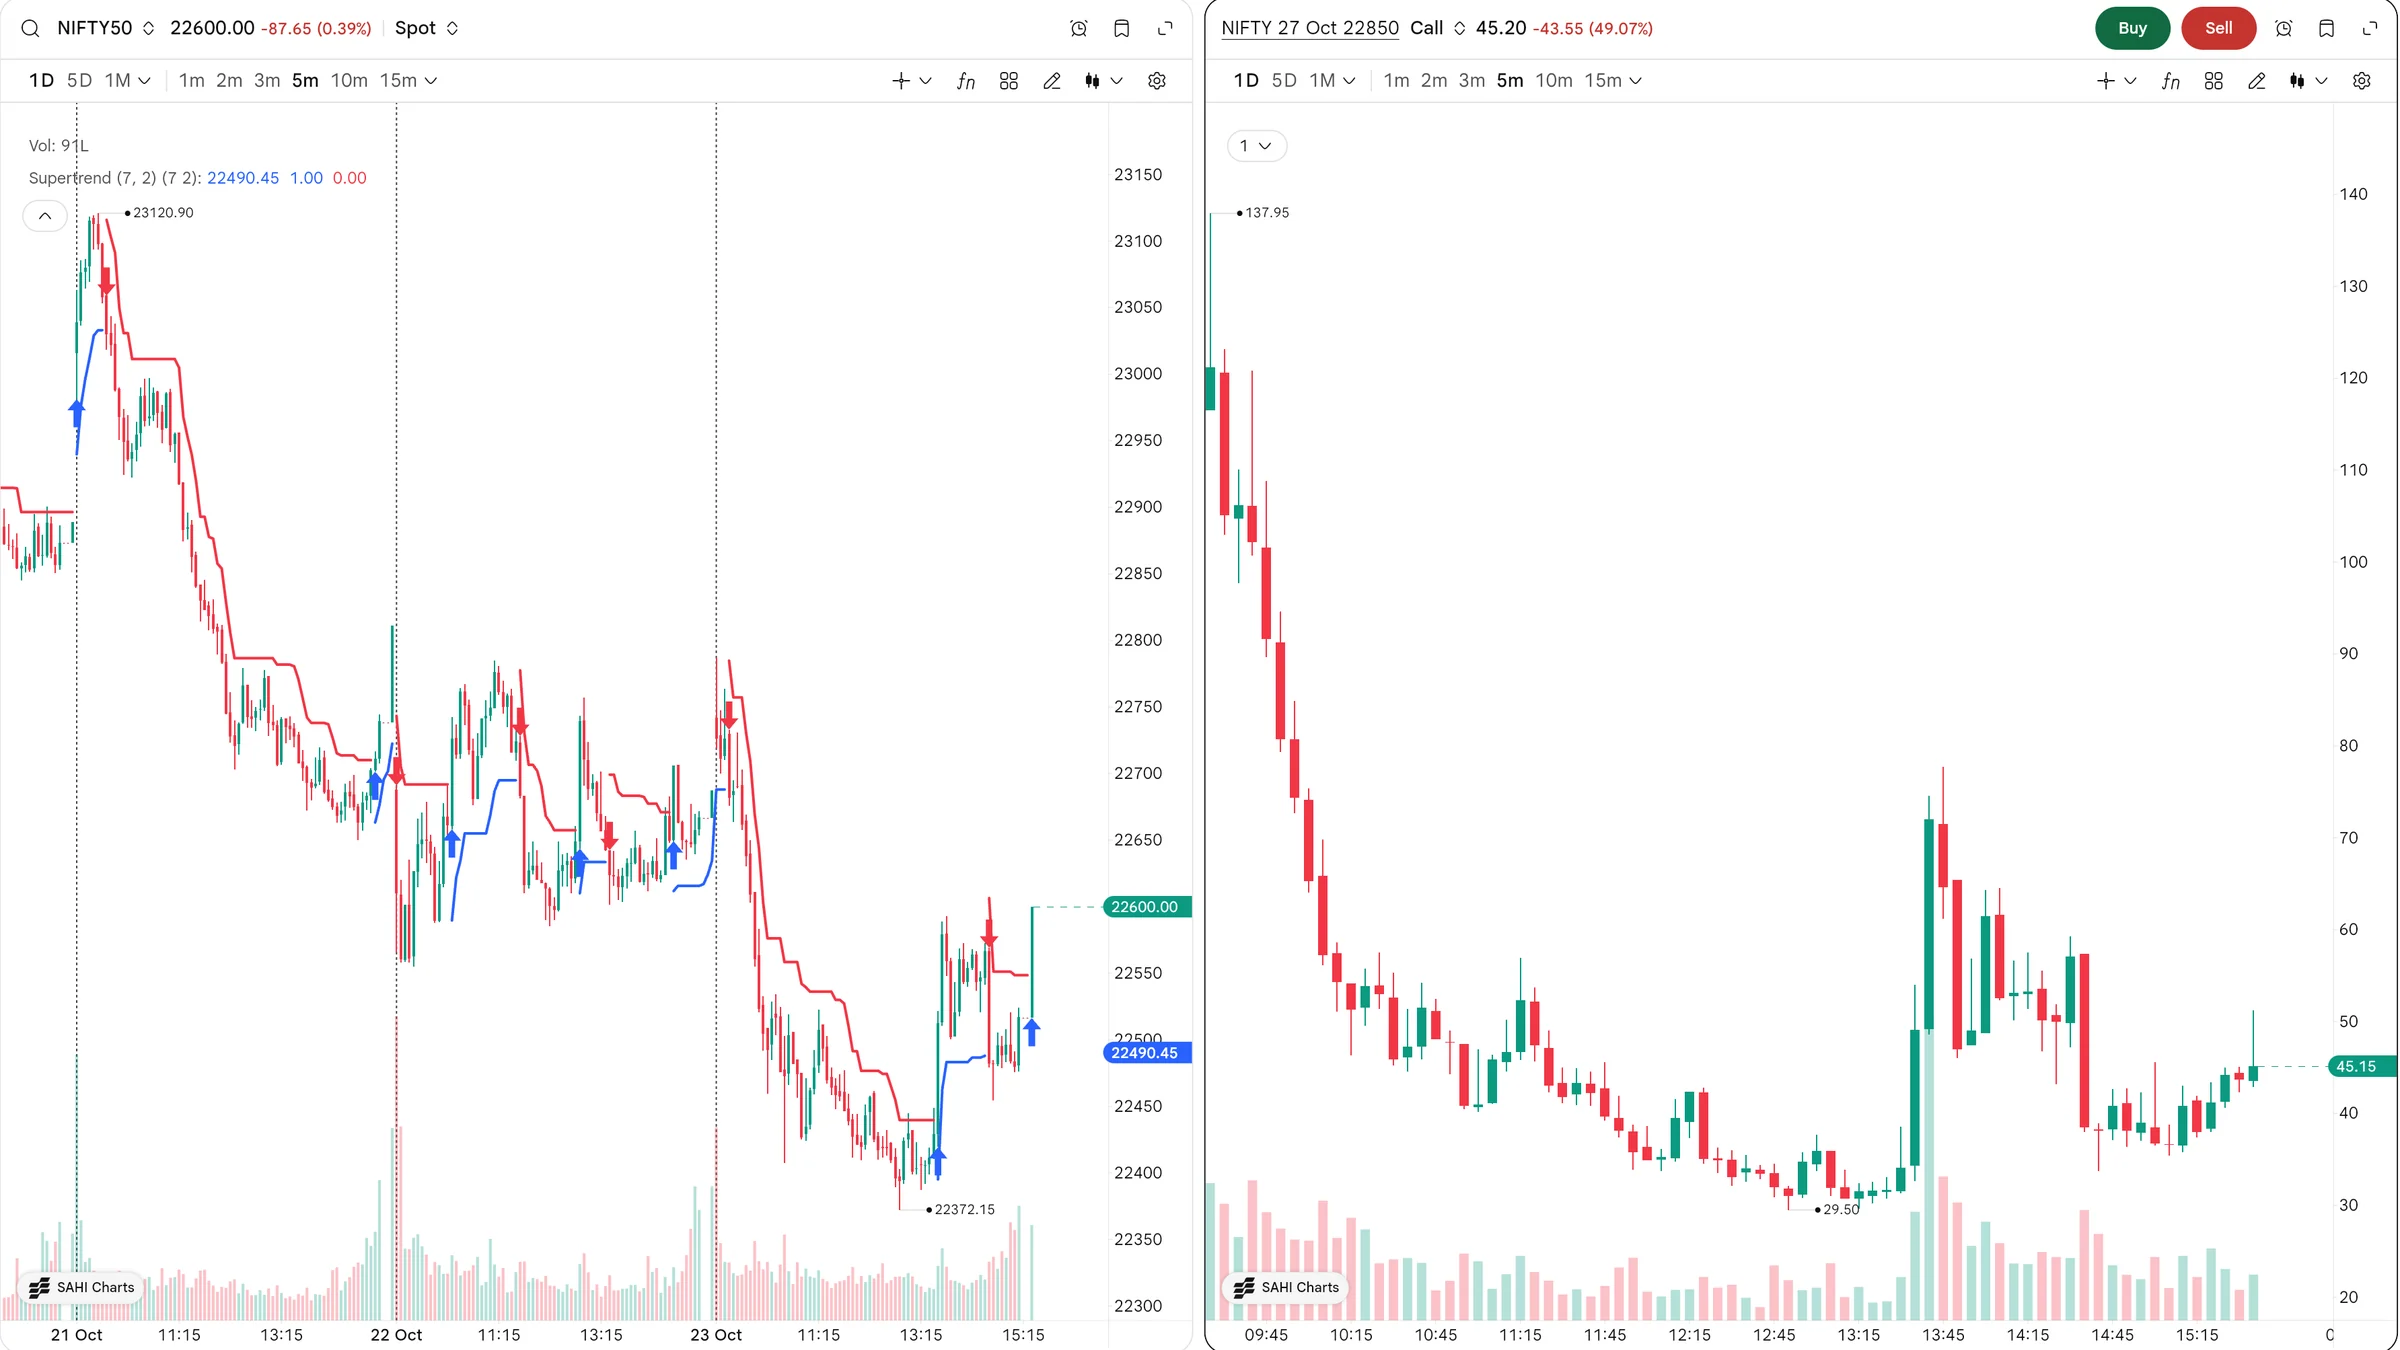
The live price in each chart header, the price label on the right edge and every watchlist and option chain price are fed by the FeedServers during market hours.
2What it is
A NIFTY tick can have tens of thousands of people waiting for it. SAHI's first FeedServer sent each tick to subscribers one after another, and the slowest ticks took 10 ms to reach everyone. Splitting subscribers across parallel shards, and a long list of tuning inside each shard, brought that to under 2 ms for 9,999 ticks in 10,000.
The FeedServers are written in Rust, with no pauses for memory clean-up. A tick is encoded once for each kind of subscription (last price, quote, full depth) and shared, not rebuilt for every user. Each connection sends whatever has piled up in one write, so a slow phone gets bigger batches and a fast one gets small, frequent ones; a connection that falls too far behind is dropped so it cannot slow the rest.
- ANIFTY50 price
22600.00, −87.65 (0.39%): live during market hours.
- COption price
The 27 Oct 22850 call at 45.20, fed by the same servers.
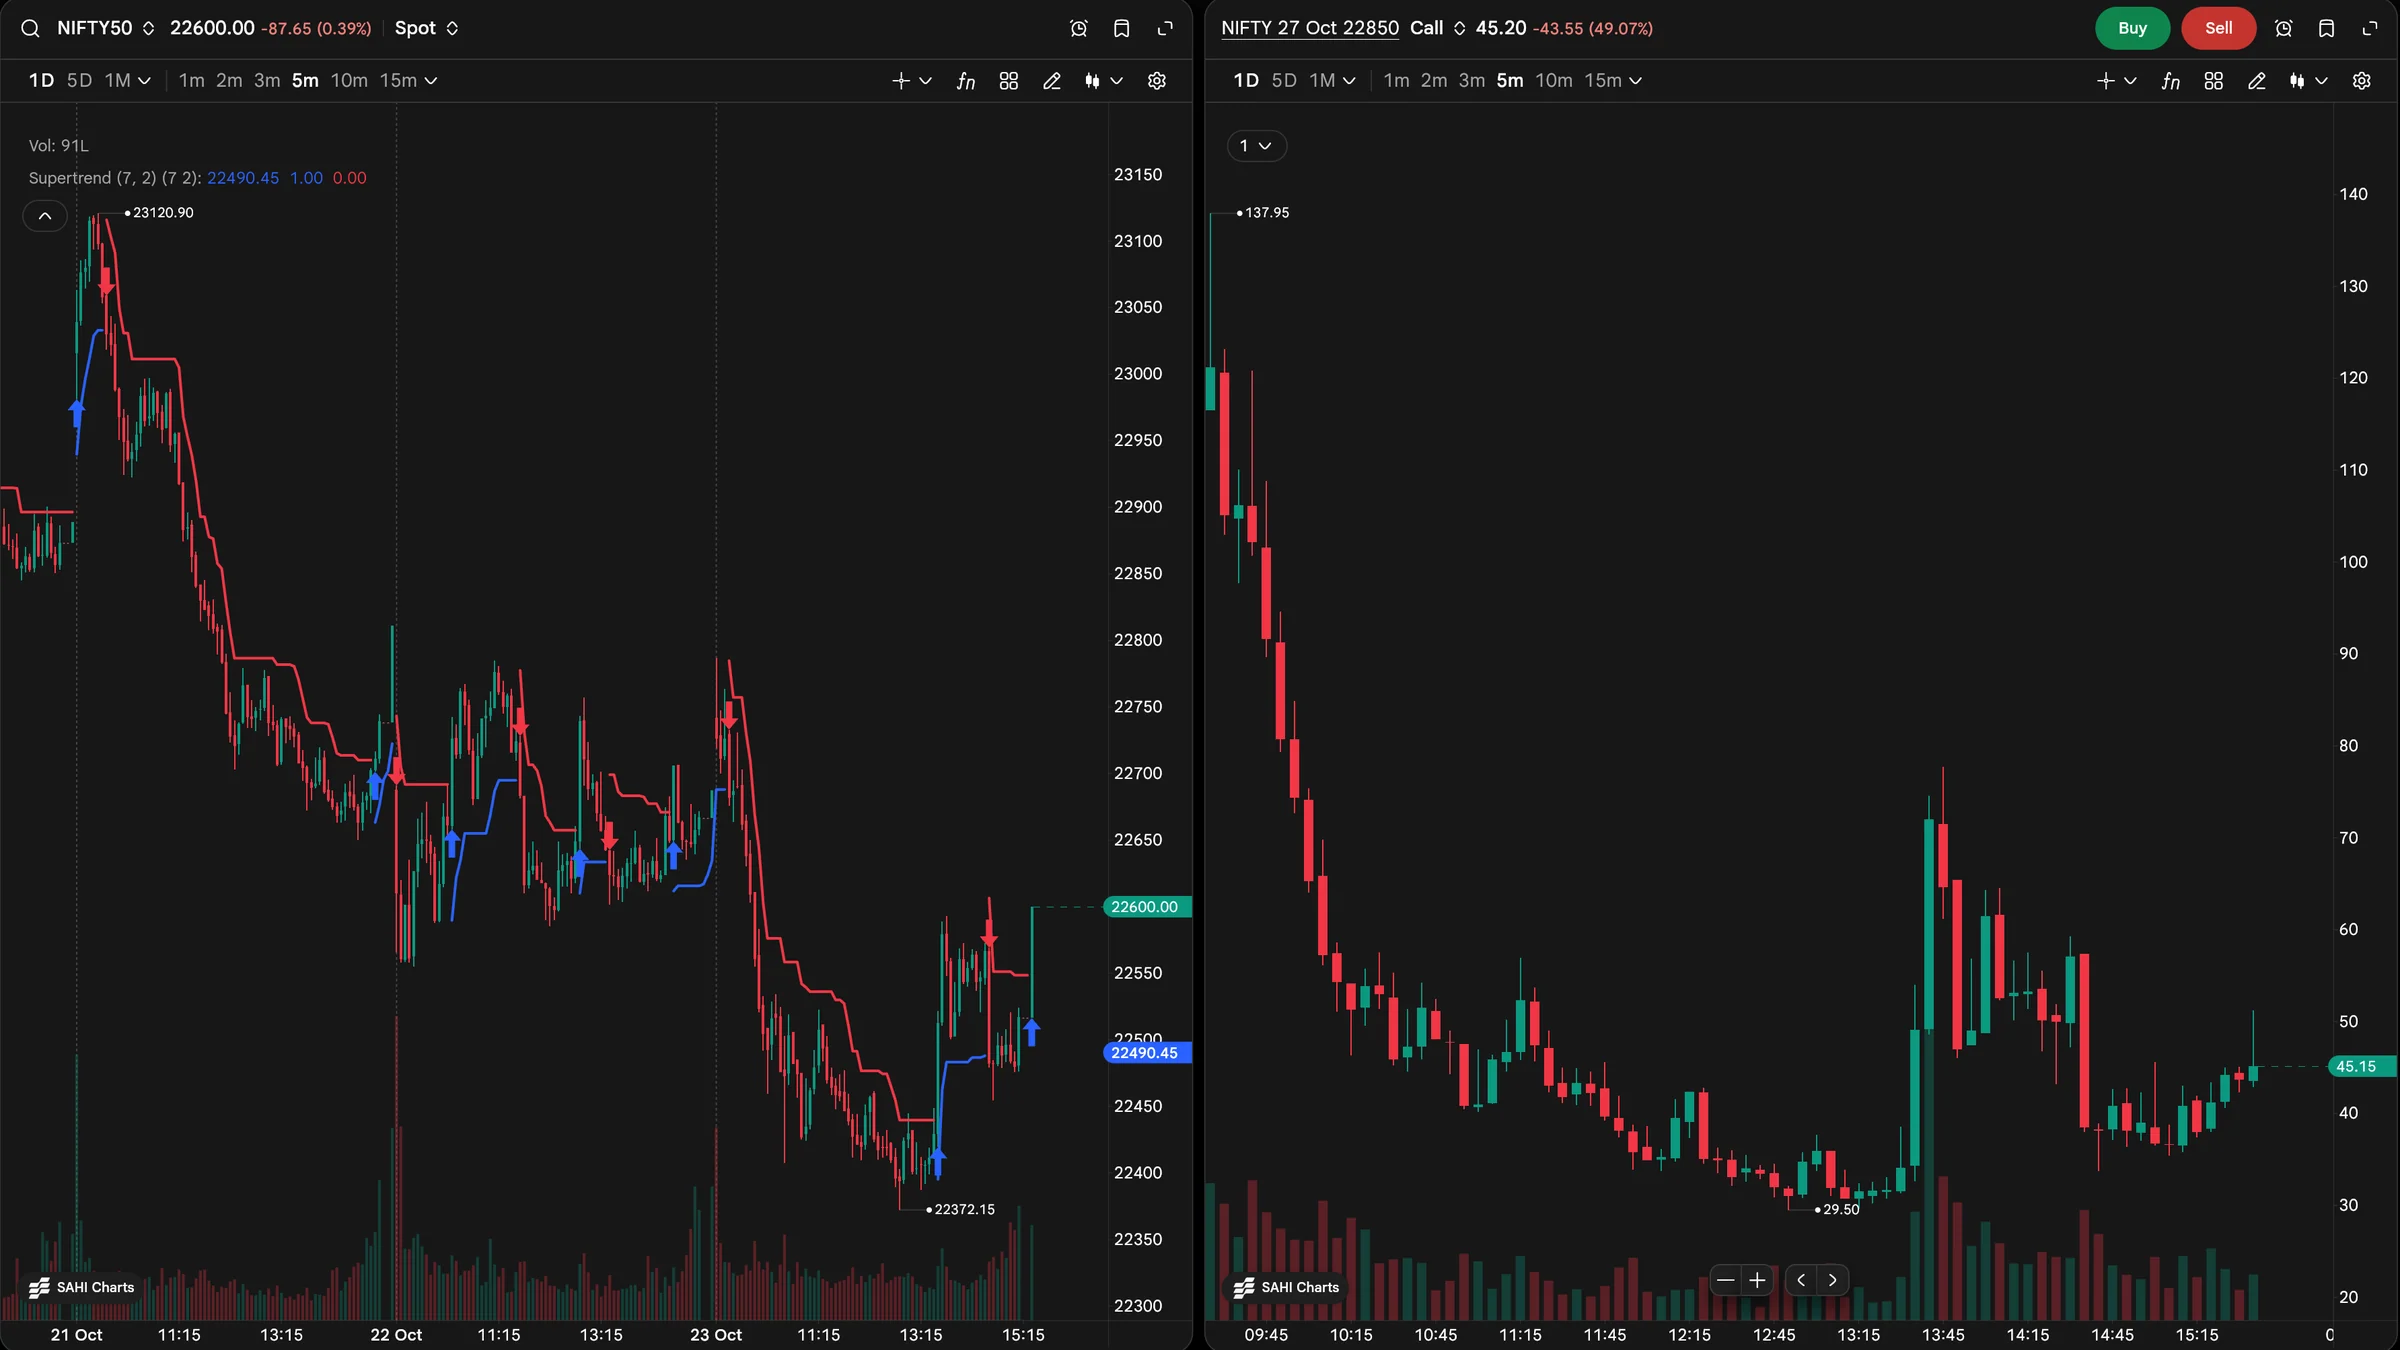
- BPrice label
Moves with every tick, on the right edge of the chart.
- DOption price label
45.15 on the last candle; ticks update it and the candle together.
3How it helps
- The price you see is the price now. A tick that takes under 2 ms to leave SAHI's servers is not what stands between you and the market.
- Busy moments stay smooth. SAHI reports about 8 billion ticks and 600,000 messages a second on a normal day, served at around 20% of three small servers, so there is room to spare when the market spikes.
On a weak mobile signal the feed sends ticks in larger batches to catch you up. If your price label stops moving during market hours, check your connection before you act on the price.
- The pictures were taken on a Sunday, so no ticks are arriving in them.
- Server timings are SAHI's; your network adds its own delay.
Charts SAHI built itself
1Where it is
WhereSAHI webSAHI appSahi Charts
Every chart on SAHI web and the app carries the SAHI Charts mark in its lower-left corner. The Buy and Sell buttons in its header place orders from the chart itself.
2What it is
Many trading apps embed a ready-made charting library inside a web view, which adds its own process, its own JavaScript and a bridge for every touch. SAHI wrote its charting engine from scratch in Flutter, with its own drawing and gestures, and the same code runs the app and the web terminal.
Because the chart talks straight to the Candles API and the FeedServers, a tick updates the chart with nothing in between. It also makes trading from the chart, showing your positions and drawing your orders at their prices part of the same chart, not add-ons.
- ABuy and Sell
Open the order window from the chart you are looking at.
- DSAHI Charts
The mark of SAHI's own charting engine, on web and app.
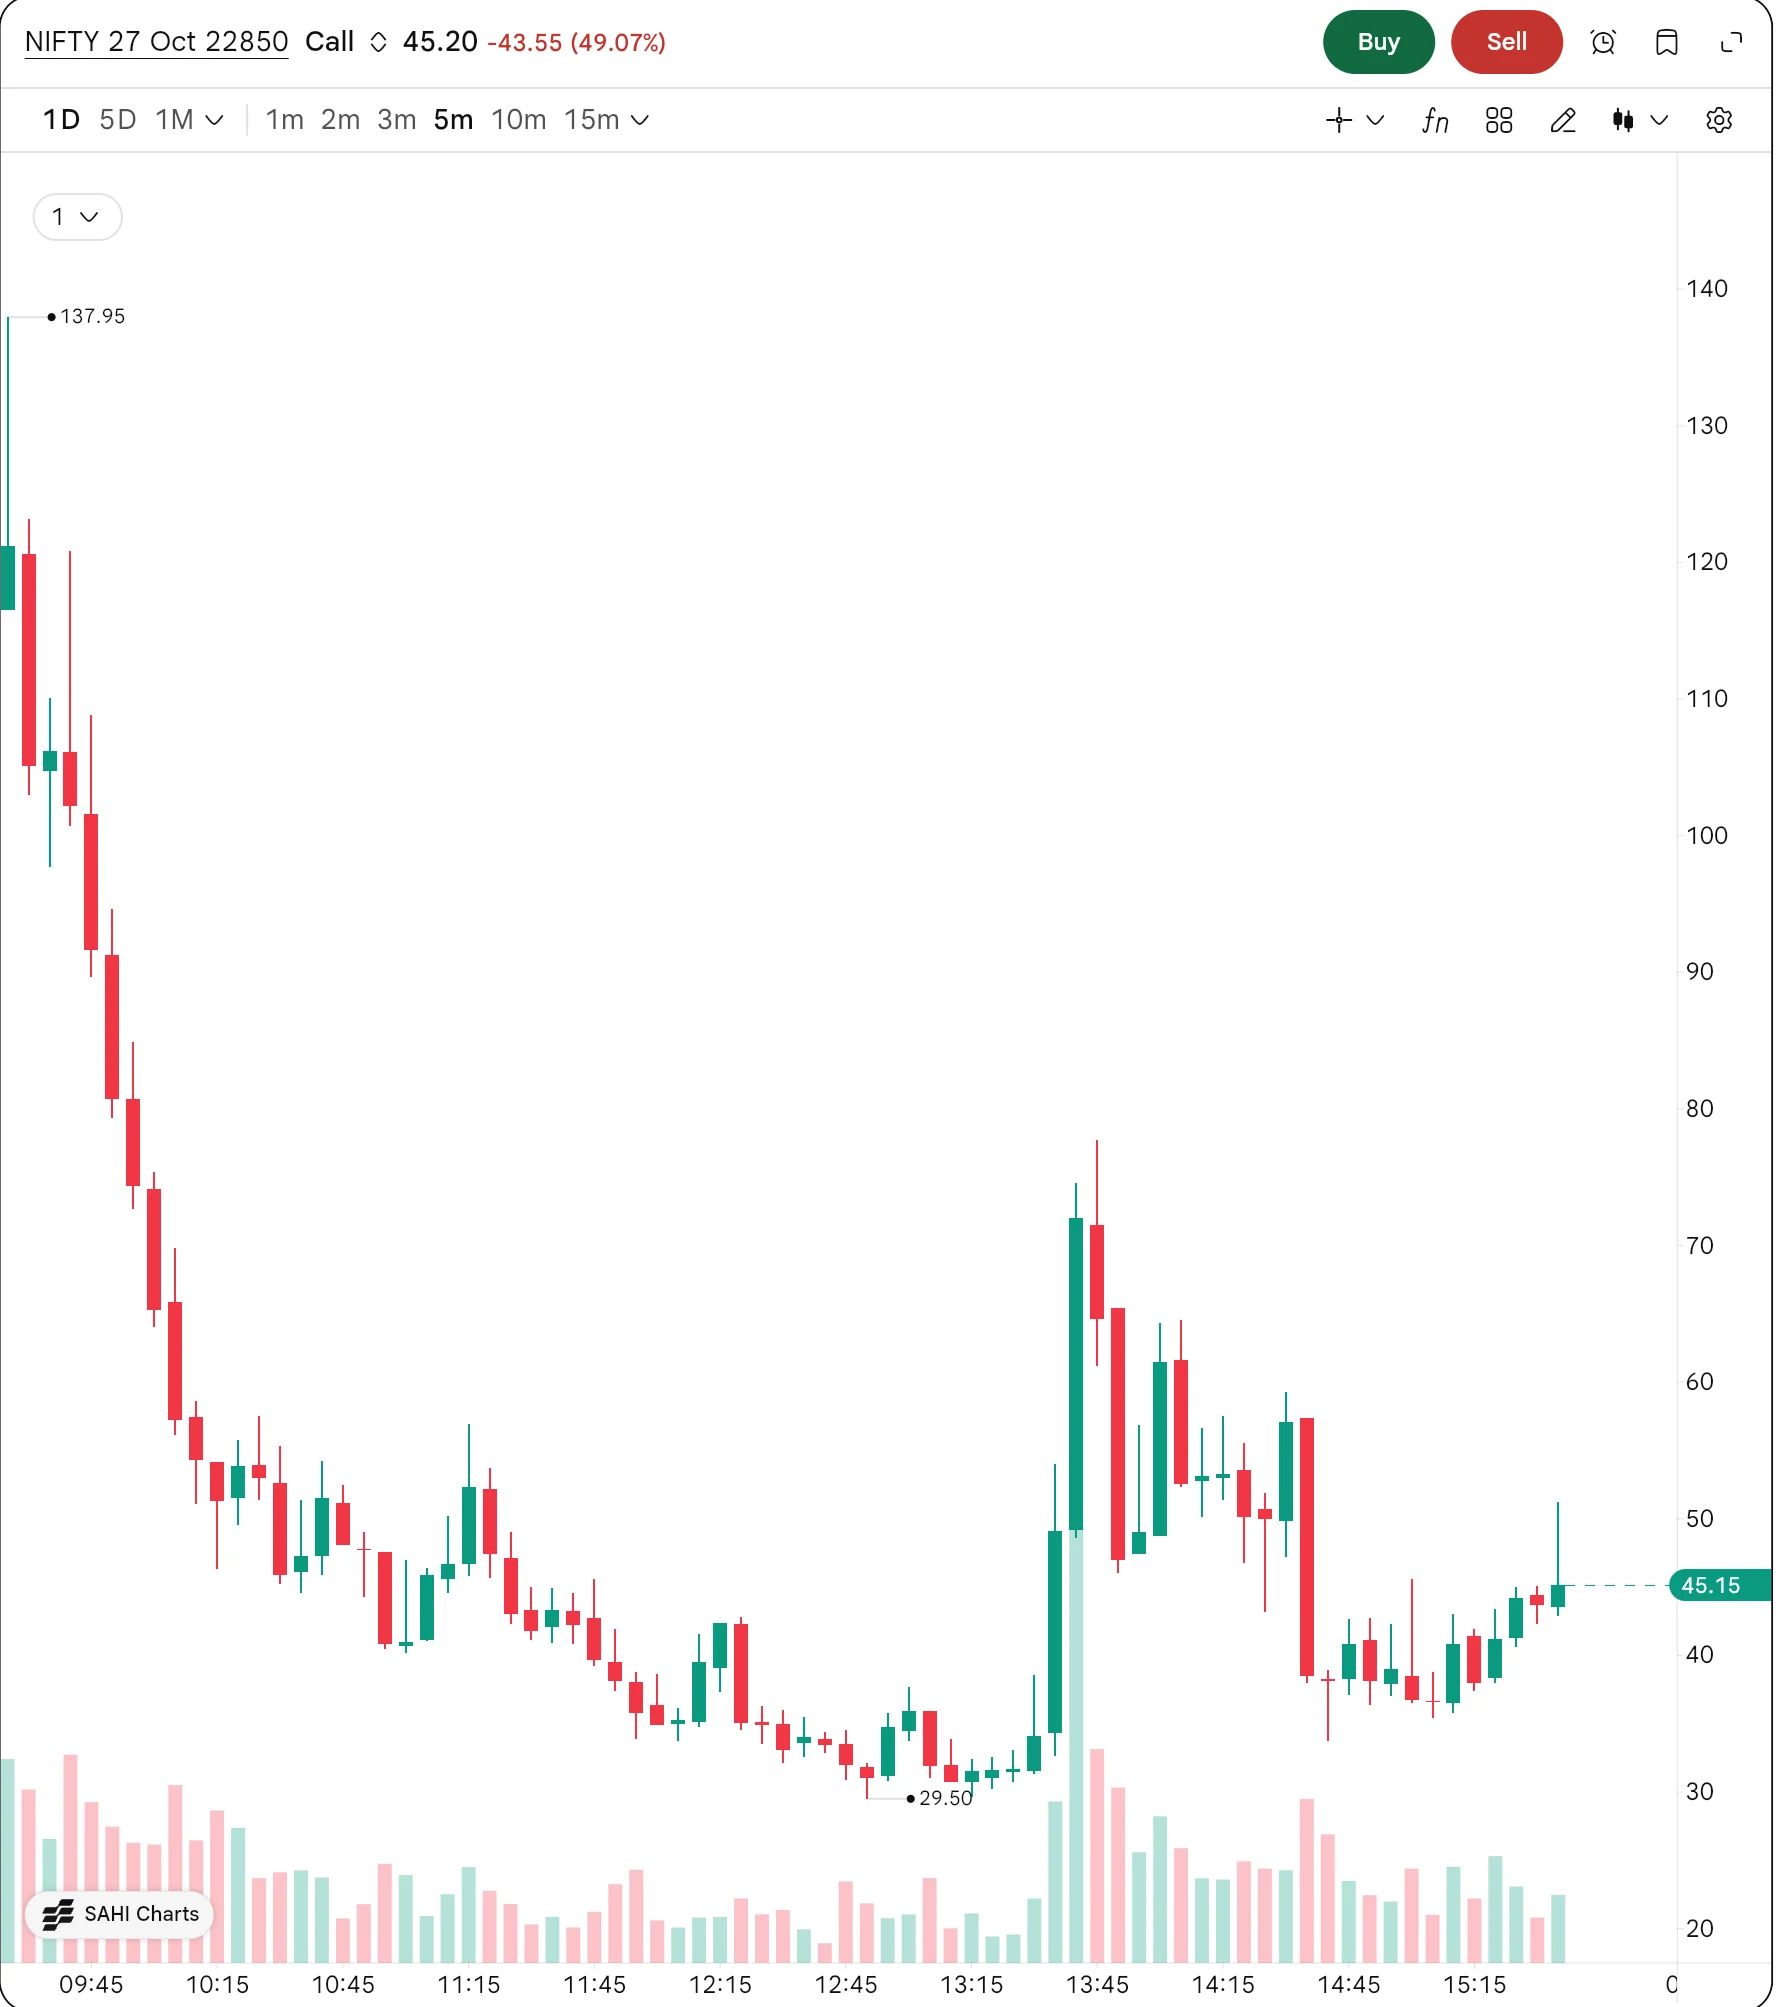
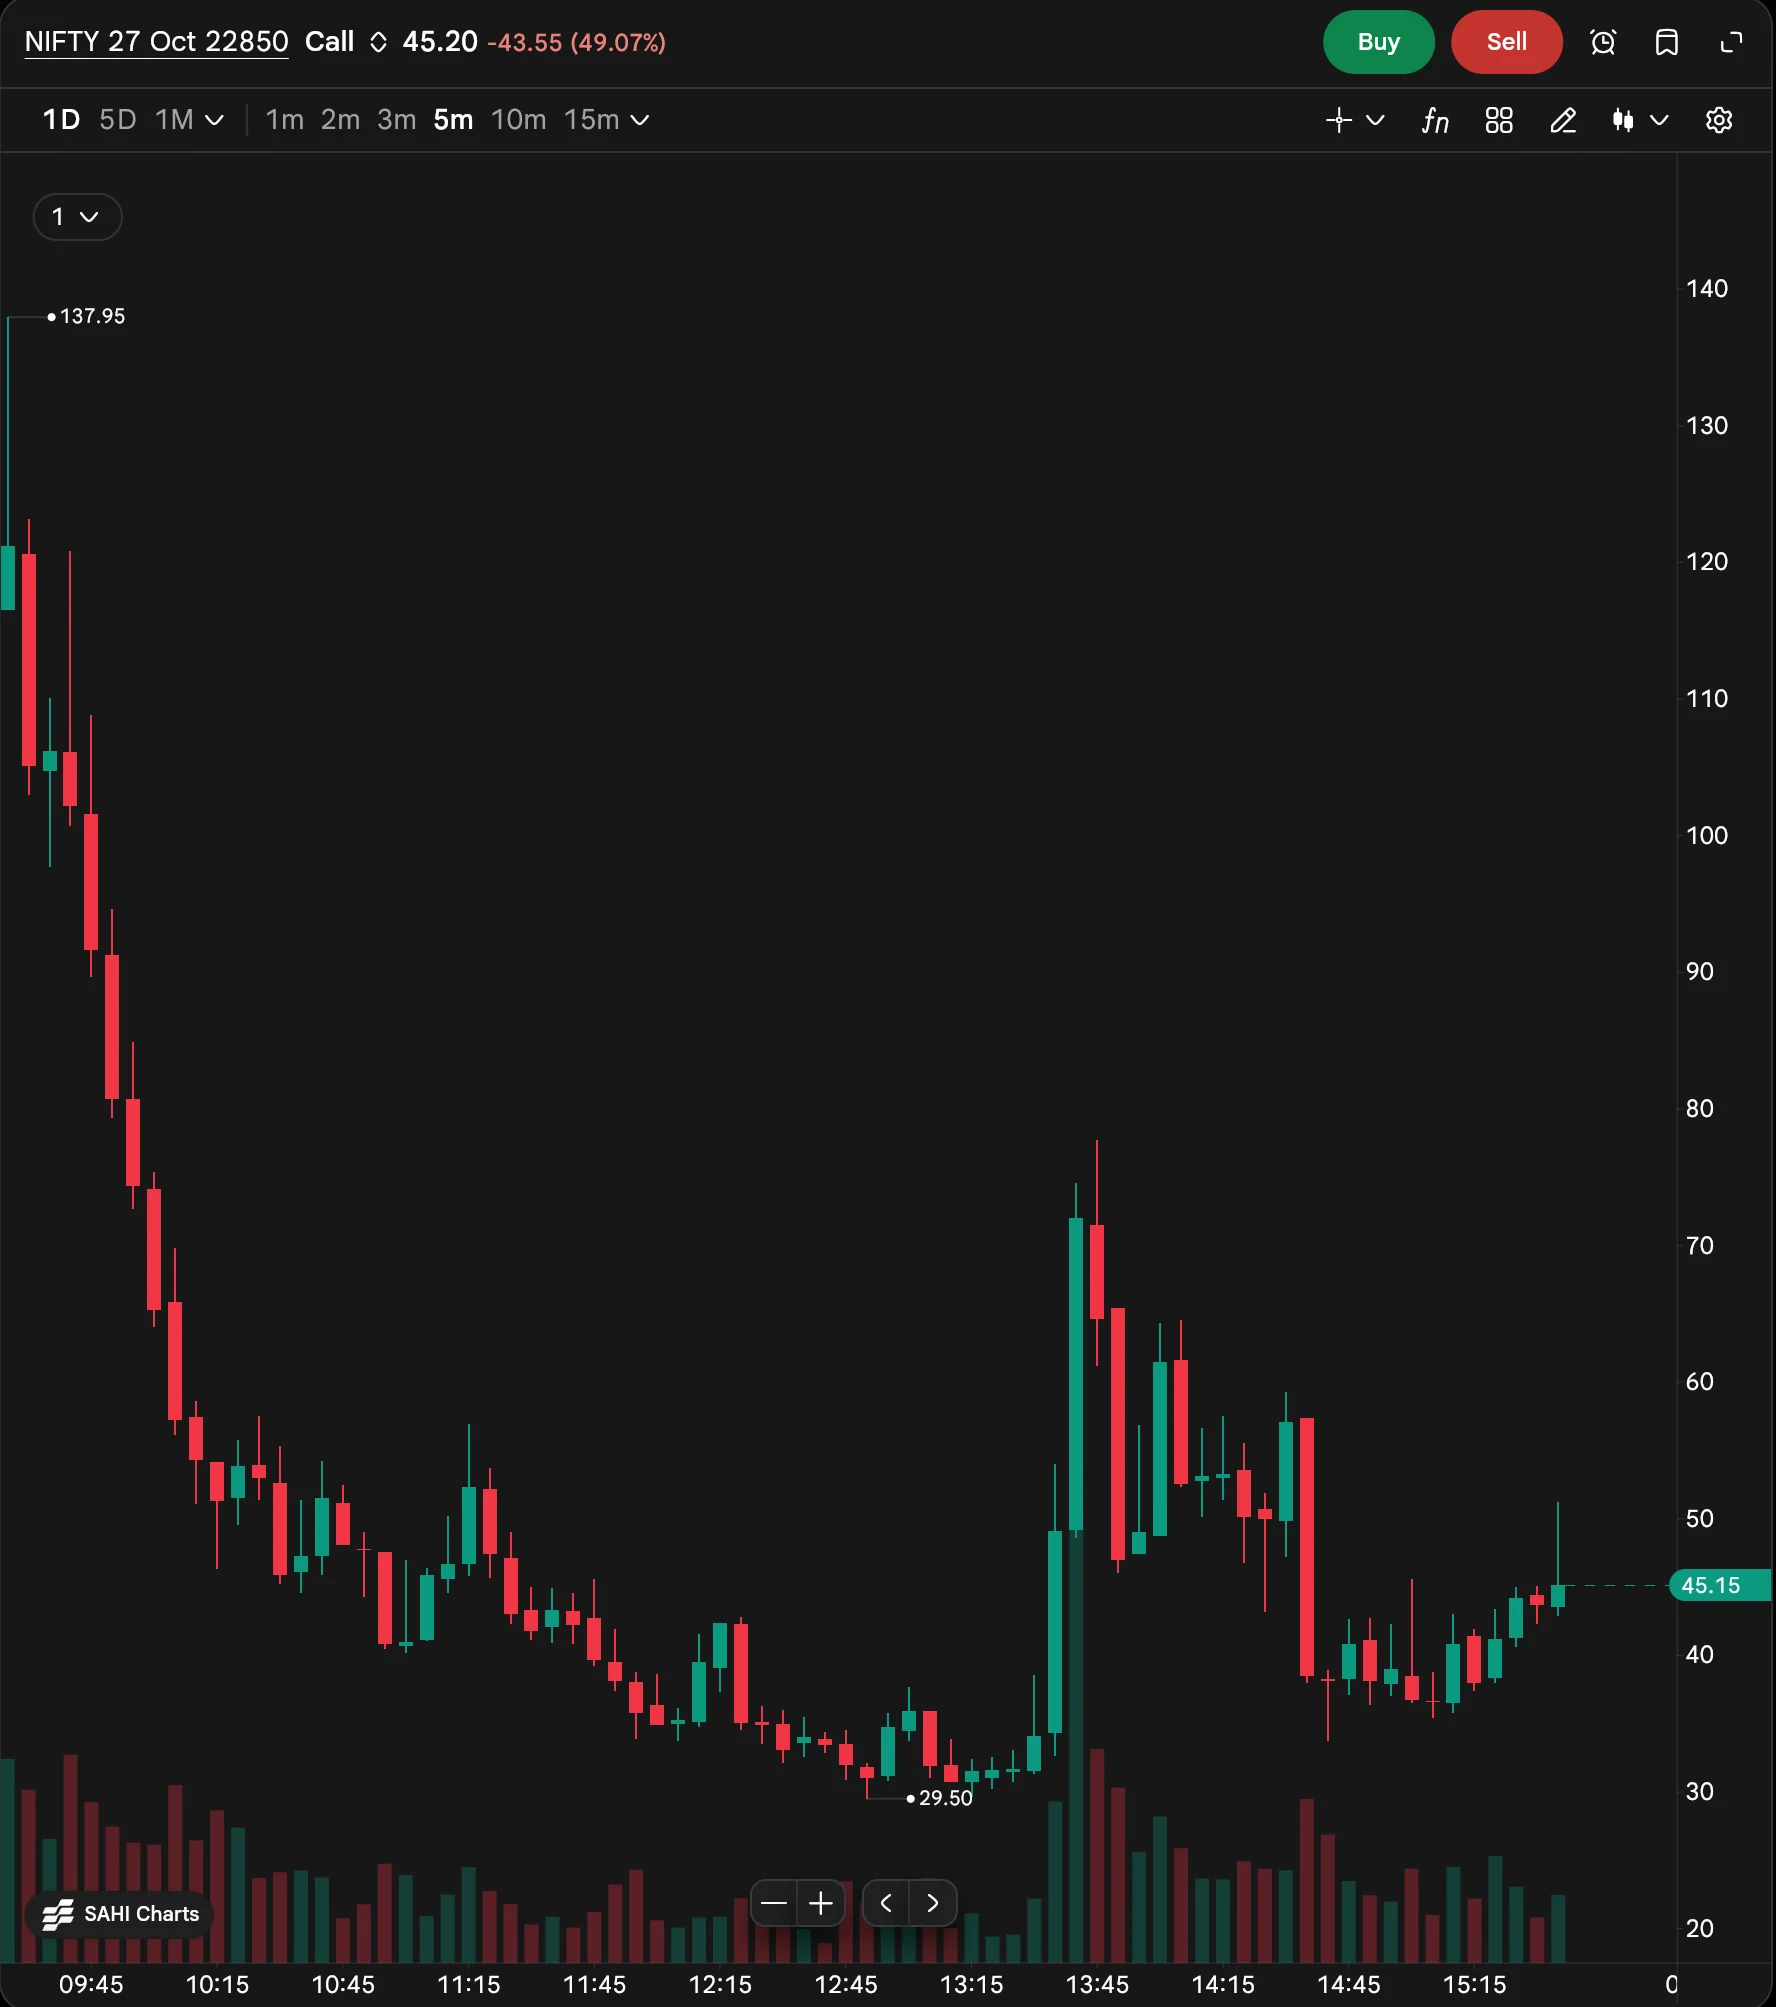
- BChart tools
Indicators, templates, drawing, chart type and settings, all SAHI's own.
- CLive candle
The last candle and its price label, updated straight from the feed.
3How it helps
- Smooth to handle. Pinch, zoom, pan and switch timeframes without the stutter a web view can add.
- Trade where you look. Buy and Sell sit on the chart, and orders and positions are drawn on it.
SAHI's challenge to readers: at the market open, pinch, zoom, scroll and switch timeframes on a busy chart, and see if you can make it stutter.
Questions
Did you measure these numbers?
No. They are the figures SAHI's engineers report in their article. Your own experience also depends on your connection and device.
What is p99 or p9999?
The time within which 99 in 100 (p99) or 9,999 in 10,000 (p9999) requests finish. It describes the slow end, not the average.
Is the web terminal's chart the same as the app's?
Yes. SAHI says the same Flutter chart code runs both.
Why does the chart in the pictures not move?
They were taken on a Sunday, after Friday's close.
See it on SAHIOpen a busy chart at the open and scroll back a year.
Open SAHI